Field note 003 / Mathematics on a GPU
What the kernels were short of
Three measured stages for the Rust matrix multiply and layer normalization, and the reasoning that chose each change, including the attempts that measured worse than what they replaced.
The second field note stopped at the point where the Rust matrix multiply reached 141.7 µs of GPU kernel time and layer normalization reached 11.1 µs, from 344.0 µs and 18.6 µs in the first comparison. This note records the stages that followed. The next matrix-multiply change was chosen from the scaling of a deliberately worse variant, which separated shared-memory load instructions from arithmetic and occupancy; the next layer-normalization change was chosen from how many threads the grid could keep resident. Several other attempts were measured and not adopted, and they are recorded here with the metric each one used.
The first field note holds the original comparison, the second the first rewrite; the journal entry for this work is How the kernel time fell, step by step.
Three stages per kernel
| Stage | Matrix multiplication | LayerNorm | Retained in |
|---|---|---|---|
| original arrangement | 343.99 µs | 18.64 µs | mage-001 |
| first rewrite (PR #42) | 141.70 µs | 11.03 µs | mage-002, mage-003 |
| second rewrite (PR #43 / #44) | 80.00 µs | 10.05 µs | mage-003 |
All six values are GPU kernel time from Nsight Systems captures: the sum of captured kernel durations over 100 iterations of the same FP32 shape. The LayerNorm value in the middle row is the warp kernel of PR #42 measured in the later capture session; the mage-002 namespace was captured in an earlier session and records 11.09 µs for the same kernel, a 0.5% difference. Every other value in the table is read from the namespace named beside it.
The spans around the call move with them: 326.72 µs → 144.41 µs → 82.60 µs for the matrix multiply, and 19.47 µs → 15.43 µs → 12.91 µs for layer normalization, each the mean of 300 warmed CUDA-event samples in three rounds.
The arrangement each kernel started from
The original tiled_matmul gives every thread one output of a 16 × 16 tile: 4096 blocks of 256 threads, 37 registers, 2048 bytes of shared memory. Its inner loop reads one value of $A$ and one value of $B$ from the shared tile for each multiply-add, so the shared-memory traffic is two reads per multiply-add, and the thread cannot reuse either value for a second output.
The original layer_norm gives each row a block of 256 threads: 4096 blocks, 27 registers, 1024 bytes of shared memory. Each row is read three times — once for the mean, once for the centered variance, once for the output — and each of the two reductions halves the block through eight barriers, so a row crosses 19 barriers before it is written out.
Both arrangements are correct and both spend shared-memory traffic and synchronization on work the arithmetic does not require. The captures price them at 343.99 µs and 18.64 µs.
The first rewrite changed the tile and the reduction
The first rewrite is the subject of field note 002, and the measurements are unchanged here. Two substitutions carry it:
tiled_matmul_registerskeeps a 4 × 4 tile of outputs per thread: sixteen multiply-adds from eight shared reads, or 0.5 reads per multiply-add, a quarter of the original. The block tile is 64 × 64, the K dimension advances in steps of 32, the tiles are loaded through 128-bit global loads into 16384 bytes of shared memory, and the grid falls from 4096 blocks to 256. Registers rise from 37 to 55.layer_norm_warpgives one warp to a row: 128-bit quads per lane, and the two reductions end inshuffle_downoffsets instead of shared memory and barriers. Shared memory falls to zero and the grid from 4096 blocks to 512; registers rise from 27 to 40.
Kernel time falls to 141.70 µs and 11.03 µs, and the event spans to 144.41 µs and 15.43 µs.
The next matrix-multiply change came from a ratio, not from a profile
Nsight Compute counters are unavailable on this host, so occupancy, cache behavior and memory throughput cannot be read directly. The alternative is to build variants that change one countable thing — here the number of shared-memory reads — and see whether the measured time moves with it.
A 32 × 32 block tile with a 2 × 4 register tile produces eight outputs from two values of $A$ and four values of $B$ per step: six shared reads for eight multiply-adds, or 0.75 per multiply-add against 0.5 for the retained 4 × 4 build — a predicted 1.5× difference if shared-memory load instructions are the limit. Measured in the same session, the CUDA-event span is 210.51 µs against 145.61 µs: 1.44×. Both variants issue the same multiply-adds, so the measured ratio follows the read count rather than the arithmetic, and a limit in occupancy would not track it at all.
Three measured steps then remove read instructions, one at a time:
| Change | Metric | Value |
|---|---|---|
| retained 4 × 4 build, K step 32 | CUDA-event span | 145.61 µs |
| the $B$ tile read as one 128-bit quad | CUDA-event span | 114.9 µs |
| the $A$ tile stored transposed, k-major, row stride 68, so the four rows a thread owns are contiguous | CUDA-event span | 89.9 µs |
| K step 32 → 64, halving the number of barrier pairs | GPU kernel time | 80.00 µs |
The first two rows and the fourth row use different instruments: the first two are CUDA-event spans from the binary’s own timing, the last is GPU kernel time from a Nsight Systems capture. They are listed with their metric for that reason and are not a single series.
The shared-read count per multiply-add falls from 0.5 to 0.125 in that step: the inner loop of the final kernel performs one 128-bit read of the transposed $A$ tile and one 128-bit read of the $B$ tile for each of 64 K-steps, producing sixteen multiply-adds per step. Shared memory grows from 16384 to 33792 bytes to hold the padded transposed tile, registers from 55 to 56, and the block count stays at 256.
The next layer-normalization change came from residency
Layer normalization moved for a different reason. The warp kernel of the first rewrite launches 512 blocks of 256 threads for 4096 rows. That is 131072 threads in total; spread over the 128 SMs of the RTX 4090 it is at most 1024 resident threads per SM, against a limit of 1536. The grid is short of resident threads, which is what keeps memory loads in flight while arithmetic is issued.
Two warps per row, each owning half a row, doubles the block count to 1024 and halves the row per warp. The two partial sums meet once in 64 bytes of shared memory behind a single barrier. Each warp accumulates the sum and the sum of squares in one pass, so the statistics need one read of the row rather than two. Registers are 39 per thread.
The A/B was five runs per build on the same input, measured by the binary’s own CUDA-event timing: one warp per row 13.76, 13.55, 13.60, 13.53, 13.76 µs (mean 13.64); two warps per row 12.87, 12.58, 12.53, 12.54, 12.94 µs (mean 12.69). The two ranges do not overlap. The retained capture prices the two-warp kernel at 10.05 µs of kernel time and 12.91 µs around the call.
What the mage-003 captures show
The retained evidence comes from the final state after PR #44: 15 Nsight Systems captures, one per operation and implementation, and three rounds of 100 warmed CUDA-event samples per implementation. The progression below is the centre of this note; four further views of the same five operations follow.
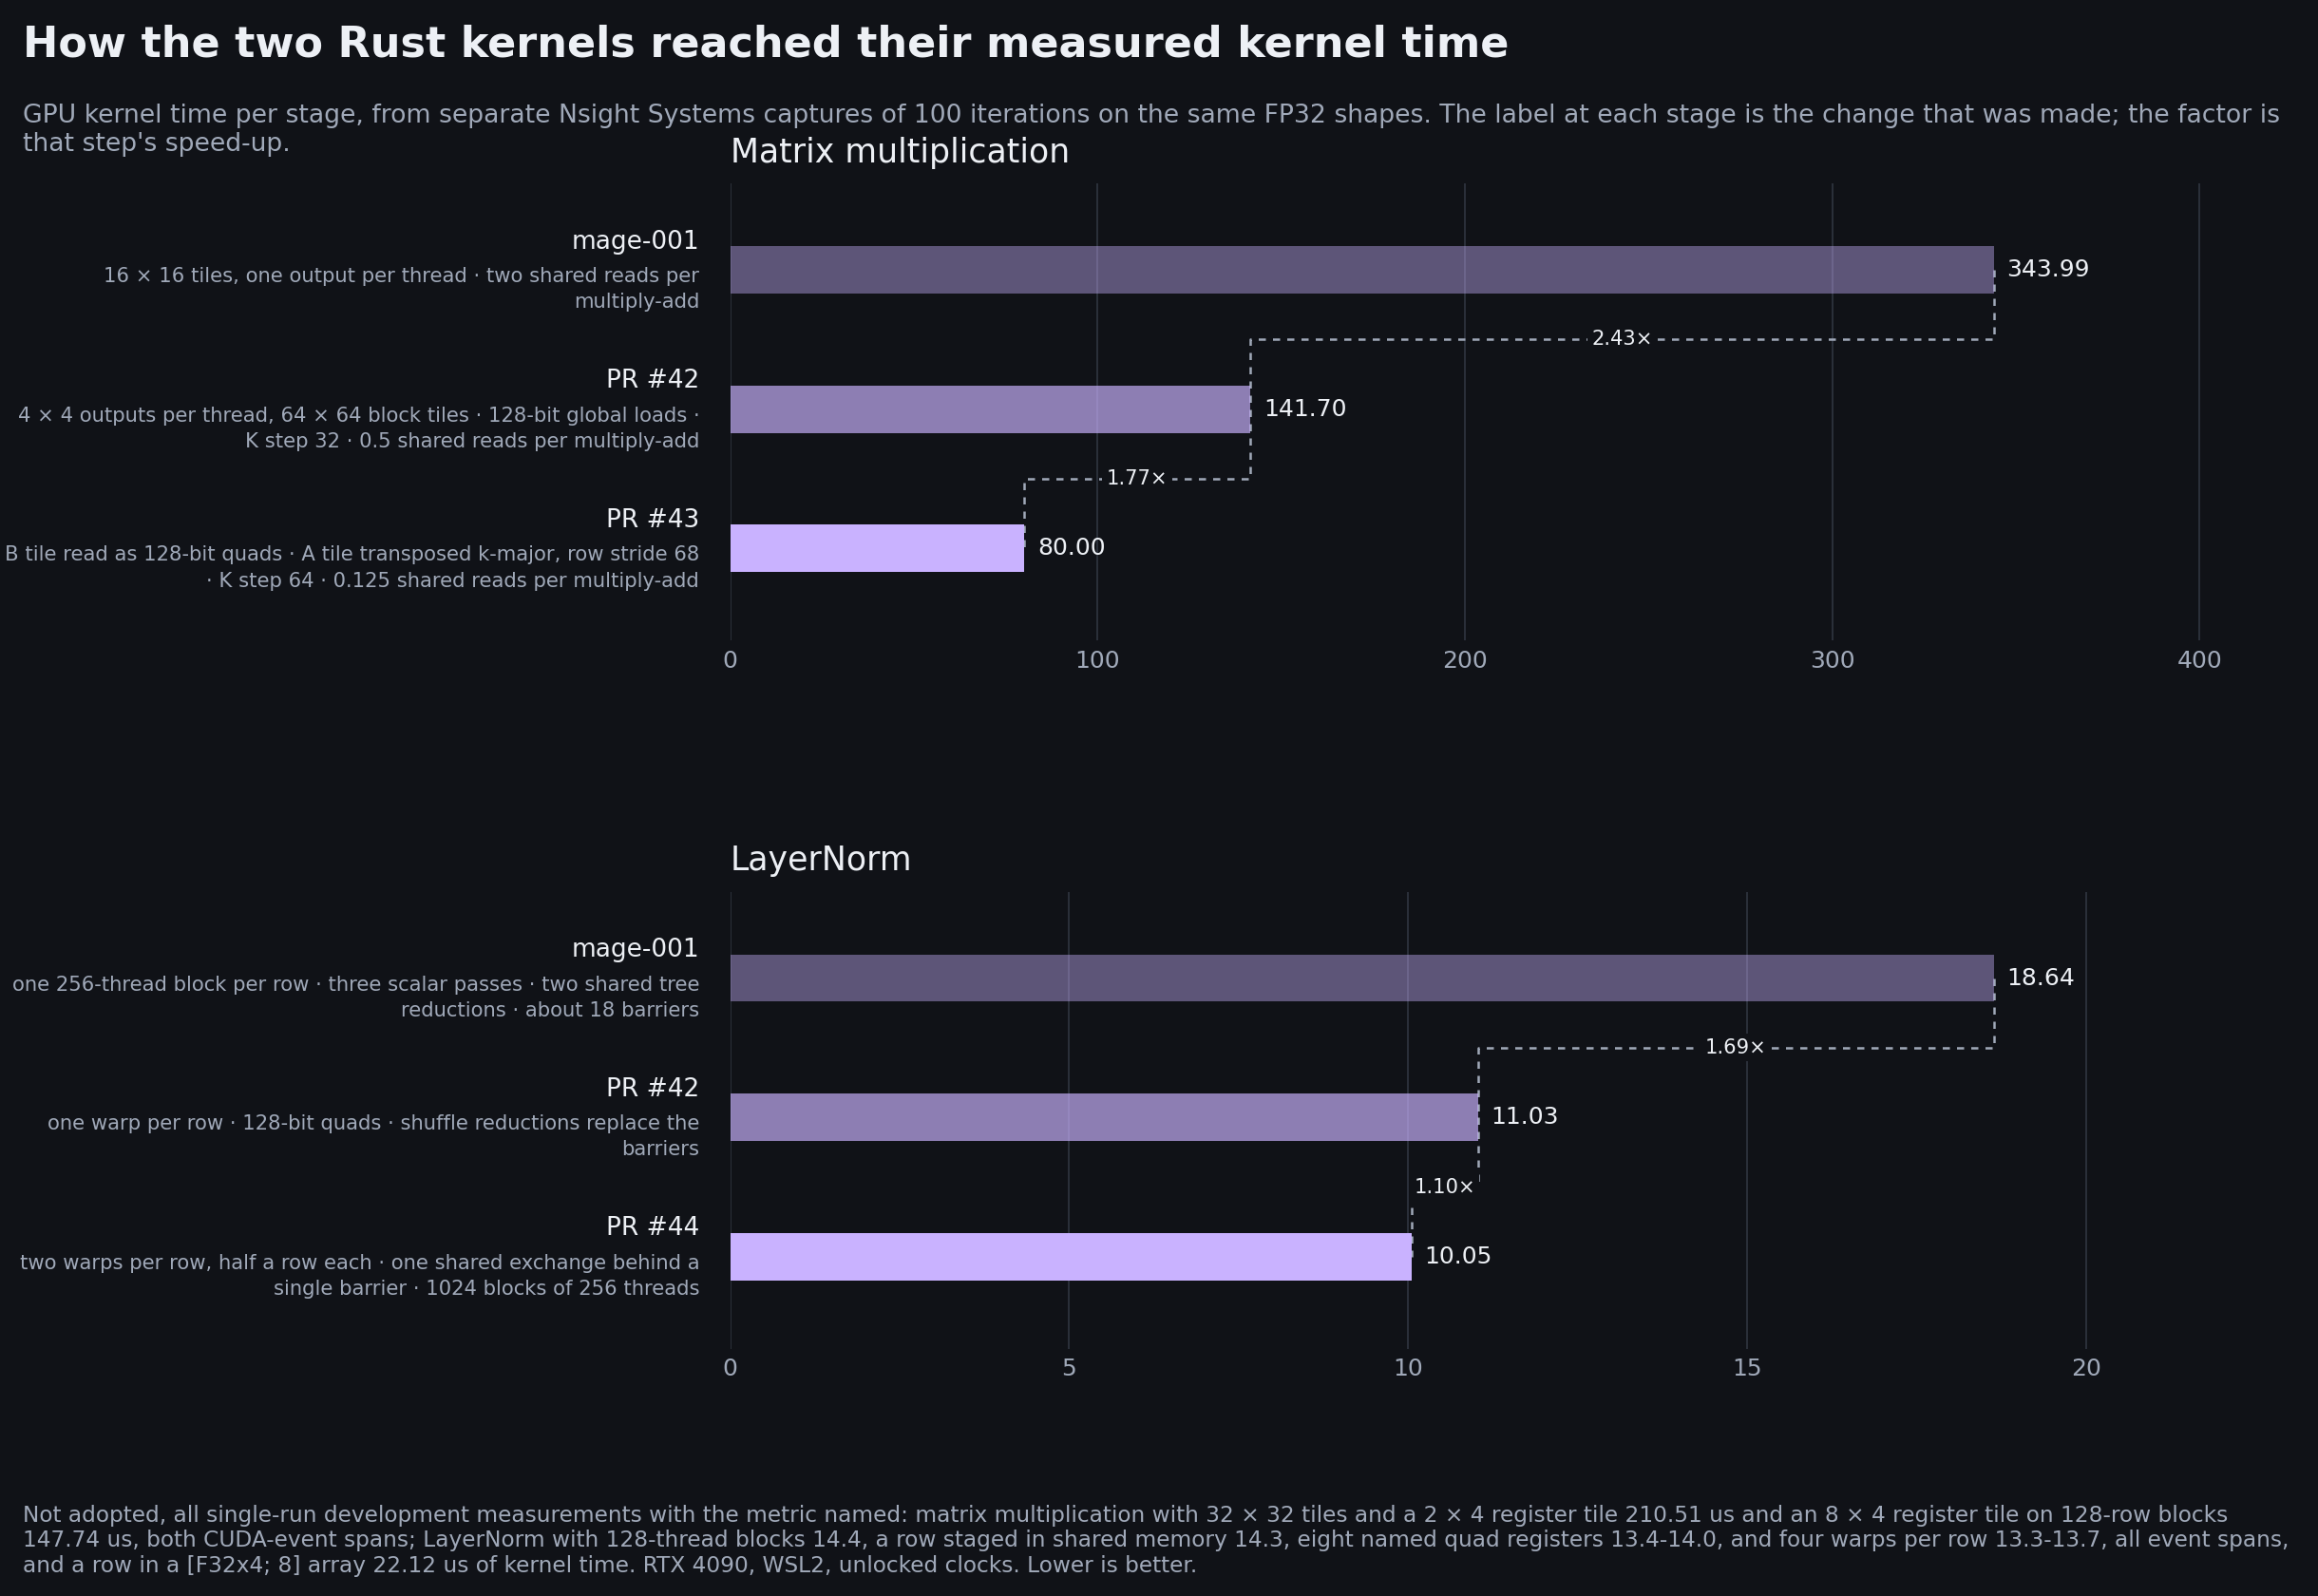
How each kernel reached its measured time:

GPU kernel time at each stage, from separate Nsight Systems captures of 100 iterations on the same FP32 shapes. The factor printed between stages is that step's speed-up. Stage values that also appear in a retained capture are read from it; the attempts that were measured and not adopted are listed separately, with their metric, in the table below.
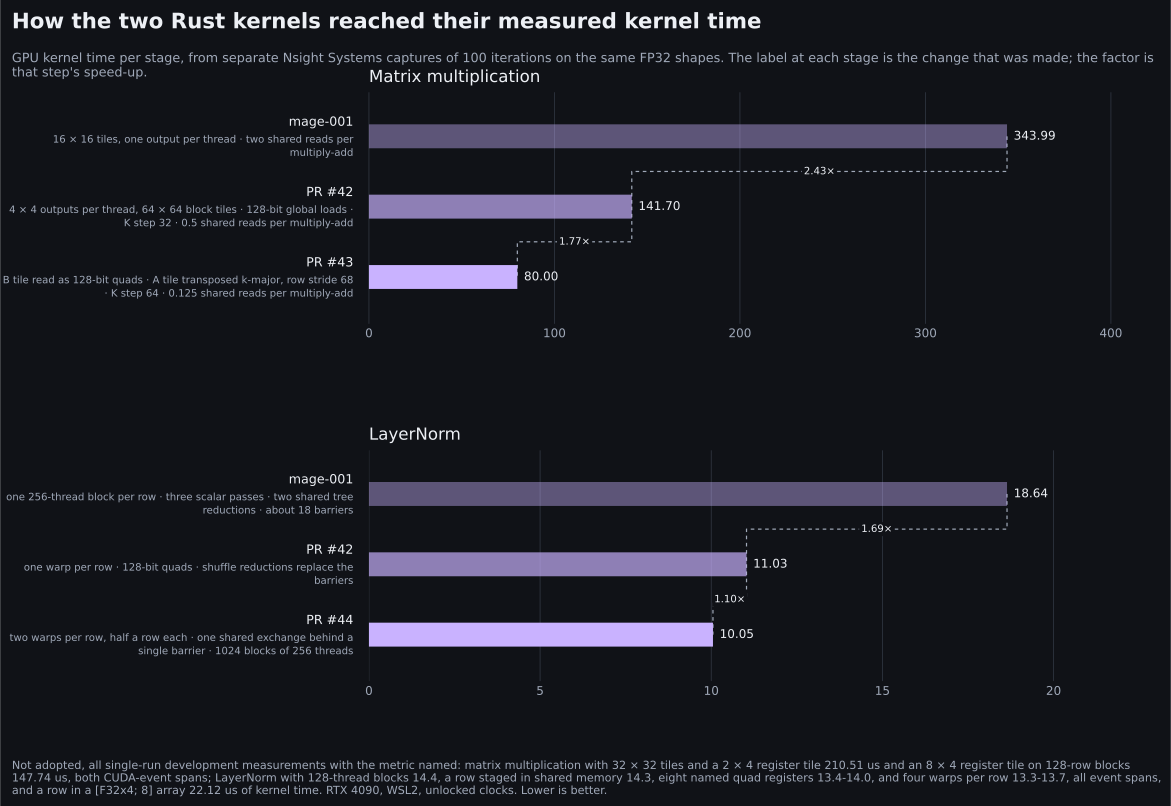
Read the plotted values (µs of GPU kernel time)
| Stage | Matrix multiplication | LayerNorm | What changed at this stage |
|---|---|---|---|
| mage-001 | 343.99 | 18.64 | 16 × 16 tiles, one output per thread; one 256-thread block per row with three passes and two tree reductions |
| PR #42 | 141.70 | 11.03 | 4 × 4 outputs per thread, 64 × 64 block tiles, 128-bit global loads, K step 32; one warp per row with 128-bit quads and shuffle reductions |
| PR #43 / #44 | 80.00 | 10.05 | 128-bit shared reads, the transposed A tile and a 64-deep K step; two warps per row with one shared exchange behind a single barrier |
Every value is GPU kernel time from a Nsight Systems capture. The LayerNorm value at PR #42 is the warp kernel as measured in the mage-003 capture session; the mage-002 namespace records 11.09 µs for the same kernel in its own session. The other five values are read from the namespace of the stage named beside them: 343.99 and 18.64 from mage-001, 141.70 from mage-002, 80.00 and 10.05 from mage-003.
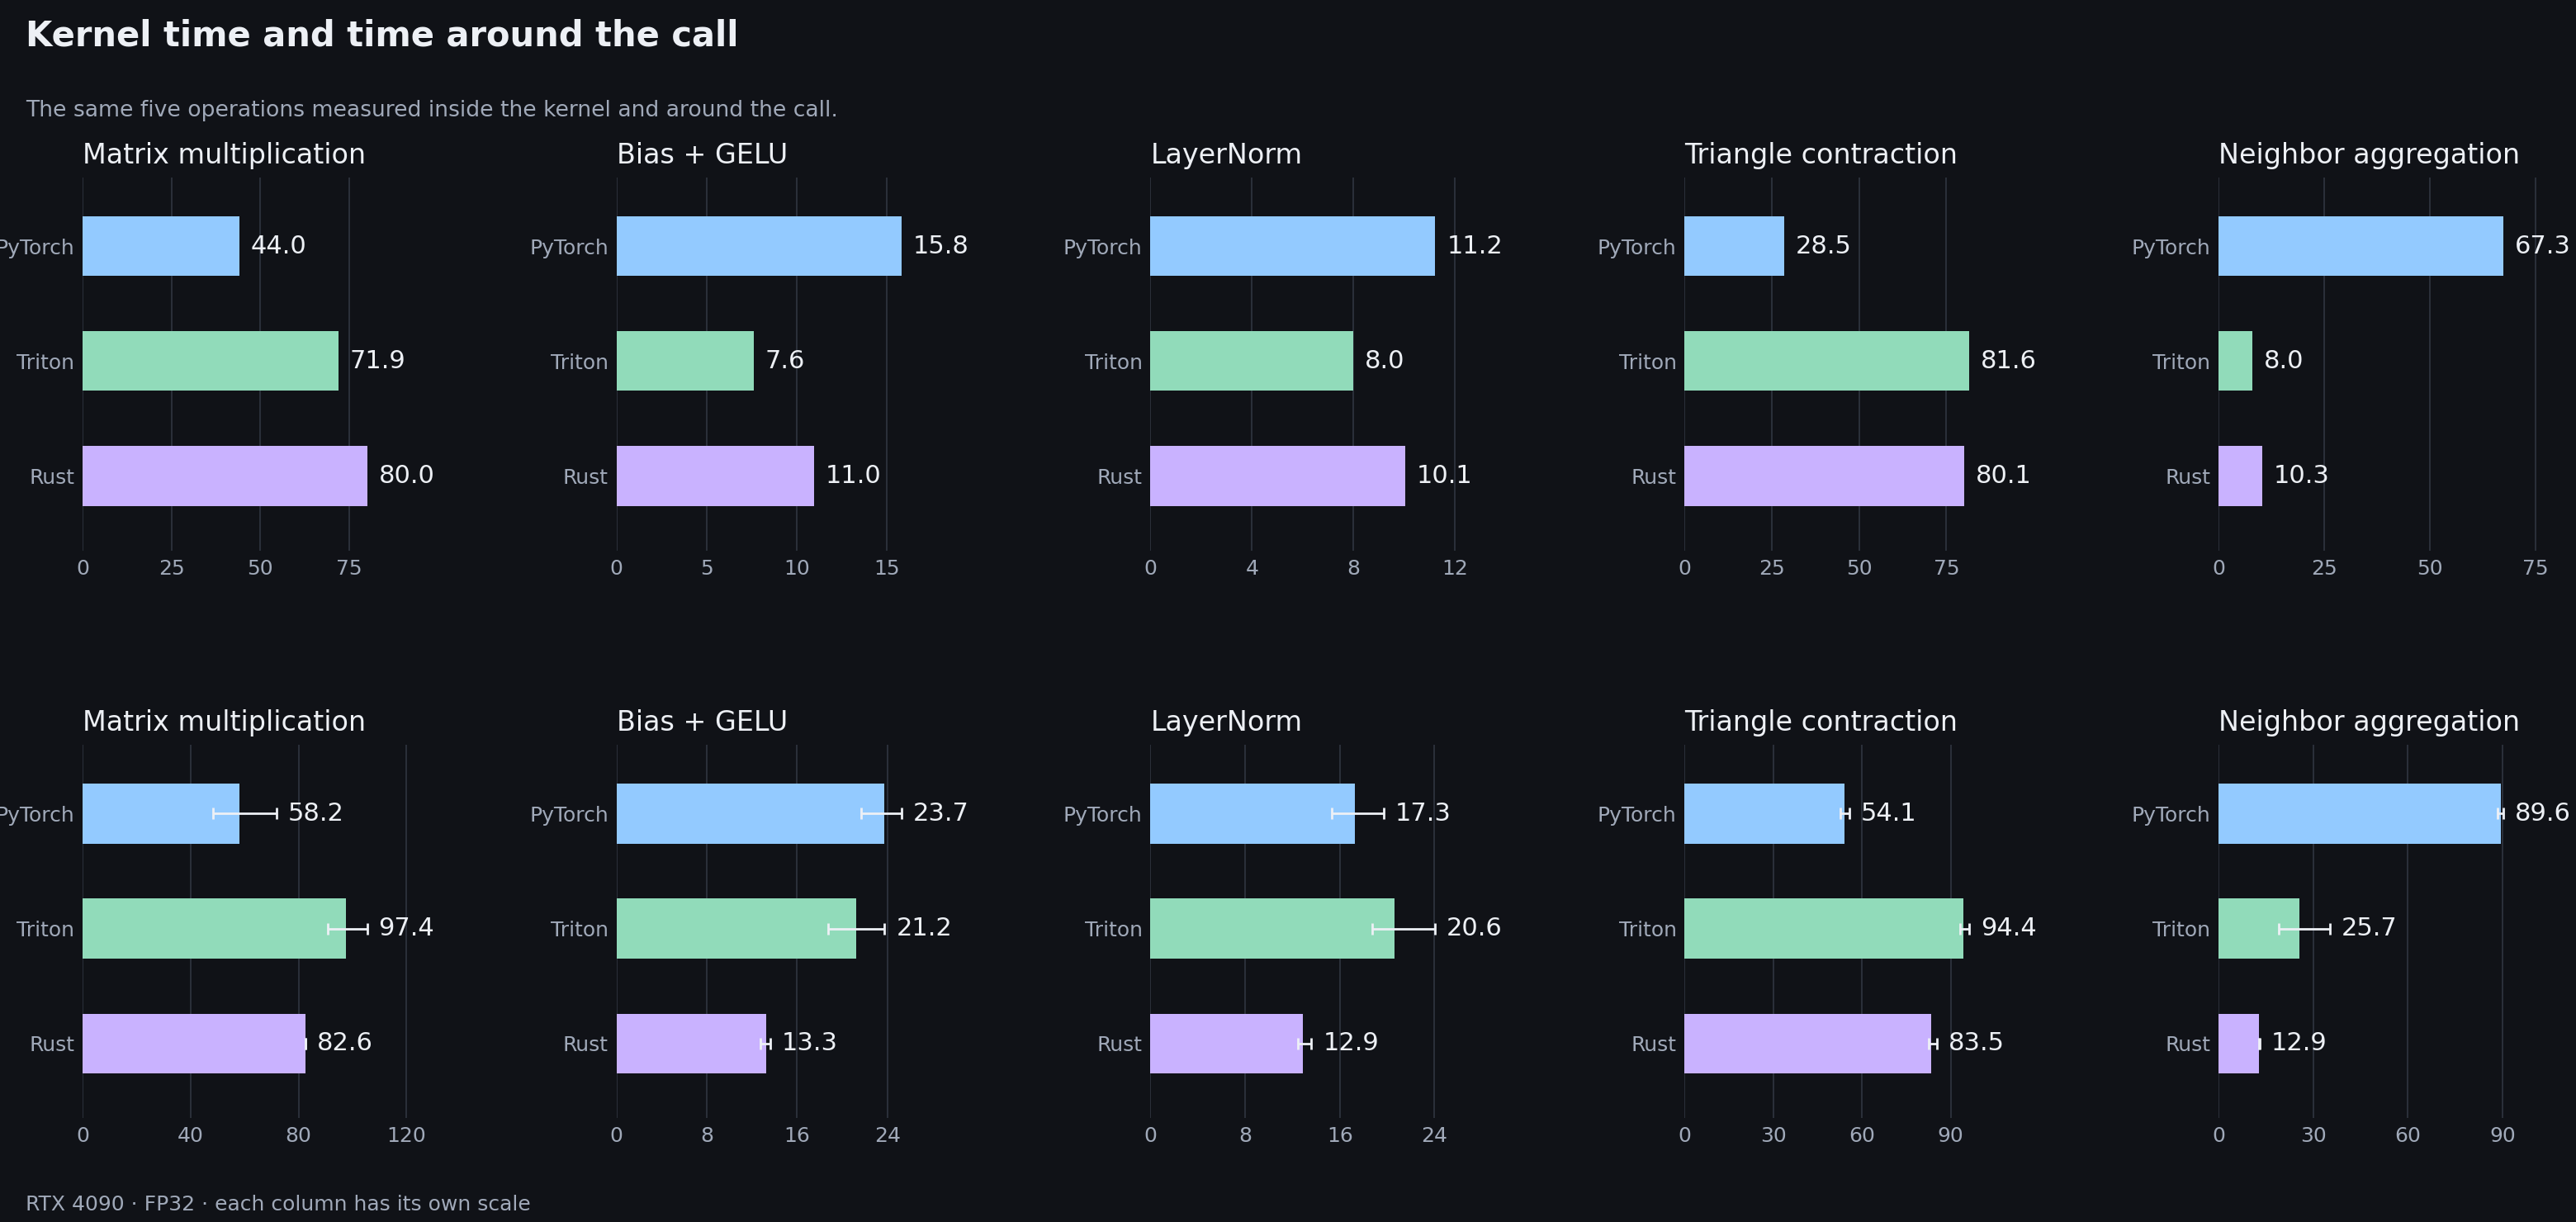
Kernel time and time around the call in one figure:

Top row: time inside the kernels. Bottom row: time around the call. Each column has its own scale, so implementations compare within a column.
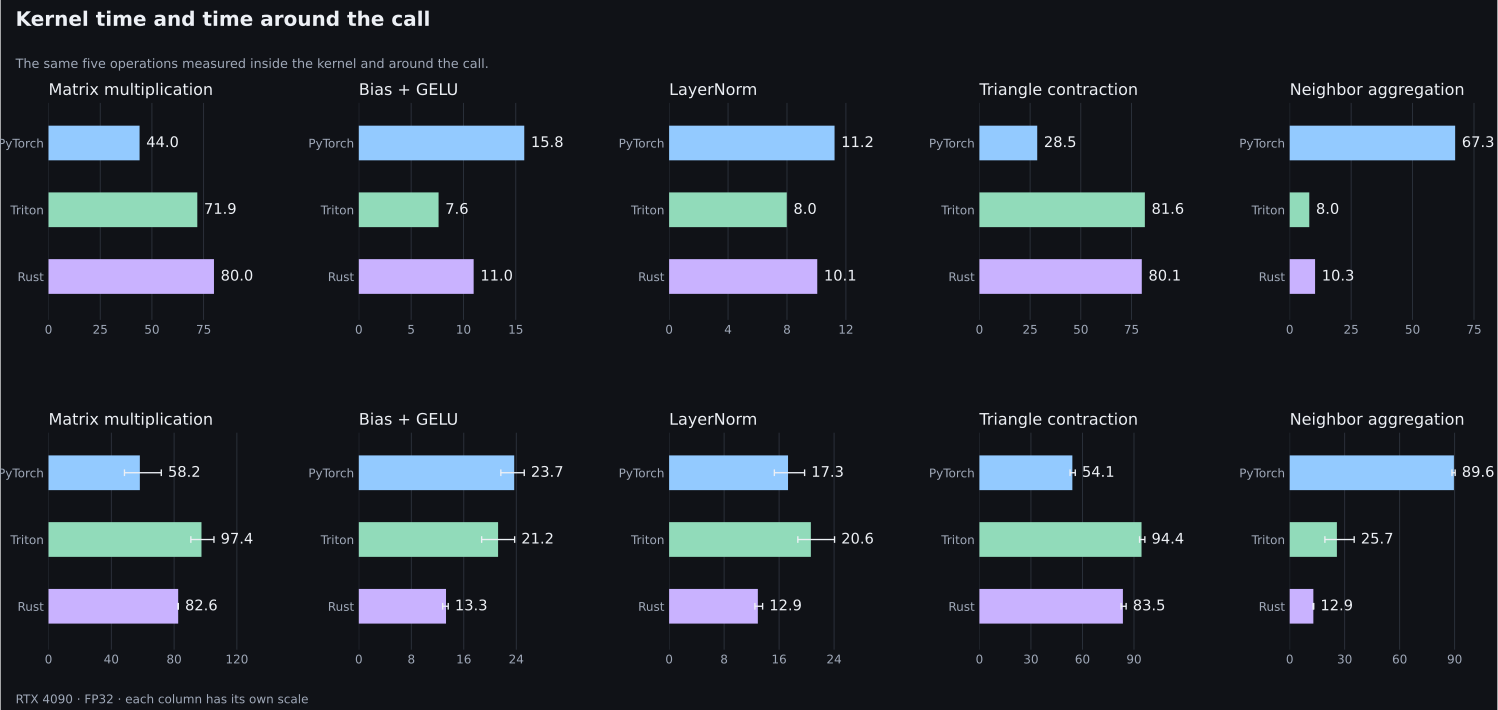
Read the plotted values (µs)
| Operation | Kernel | Span | mage-001 kernel | mage-002 kernel |
|---|---|---|---|---|
| Matrix multiplication | 80.0 | 82.6 | 344.0 | 141.7 |
| Bias + GELU | 11.0 | 13.3 | 11.2 | 11.0 |
| LayerNorm | 10.1 | 12.9 | 18.6 | 11.1 |
| Triangle contraction | 80.1 | 83.5 | 81.2 | 80.4 |
| Neighbor aggregation | 10.3 | 12.9 | 10.3 | 10.3 |
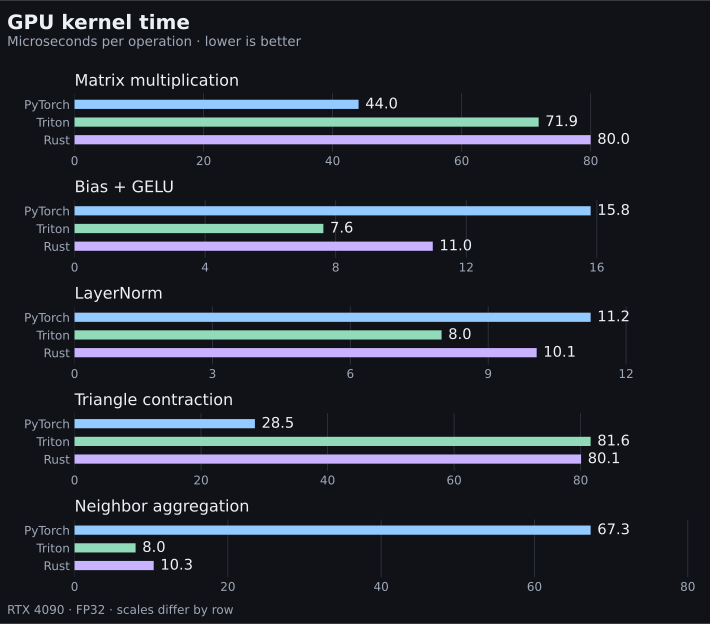
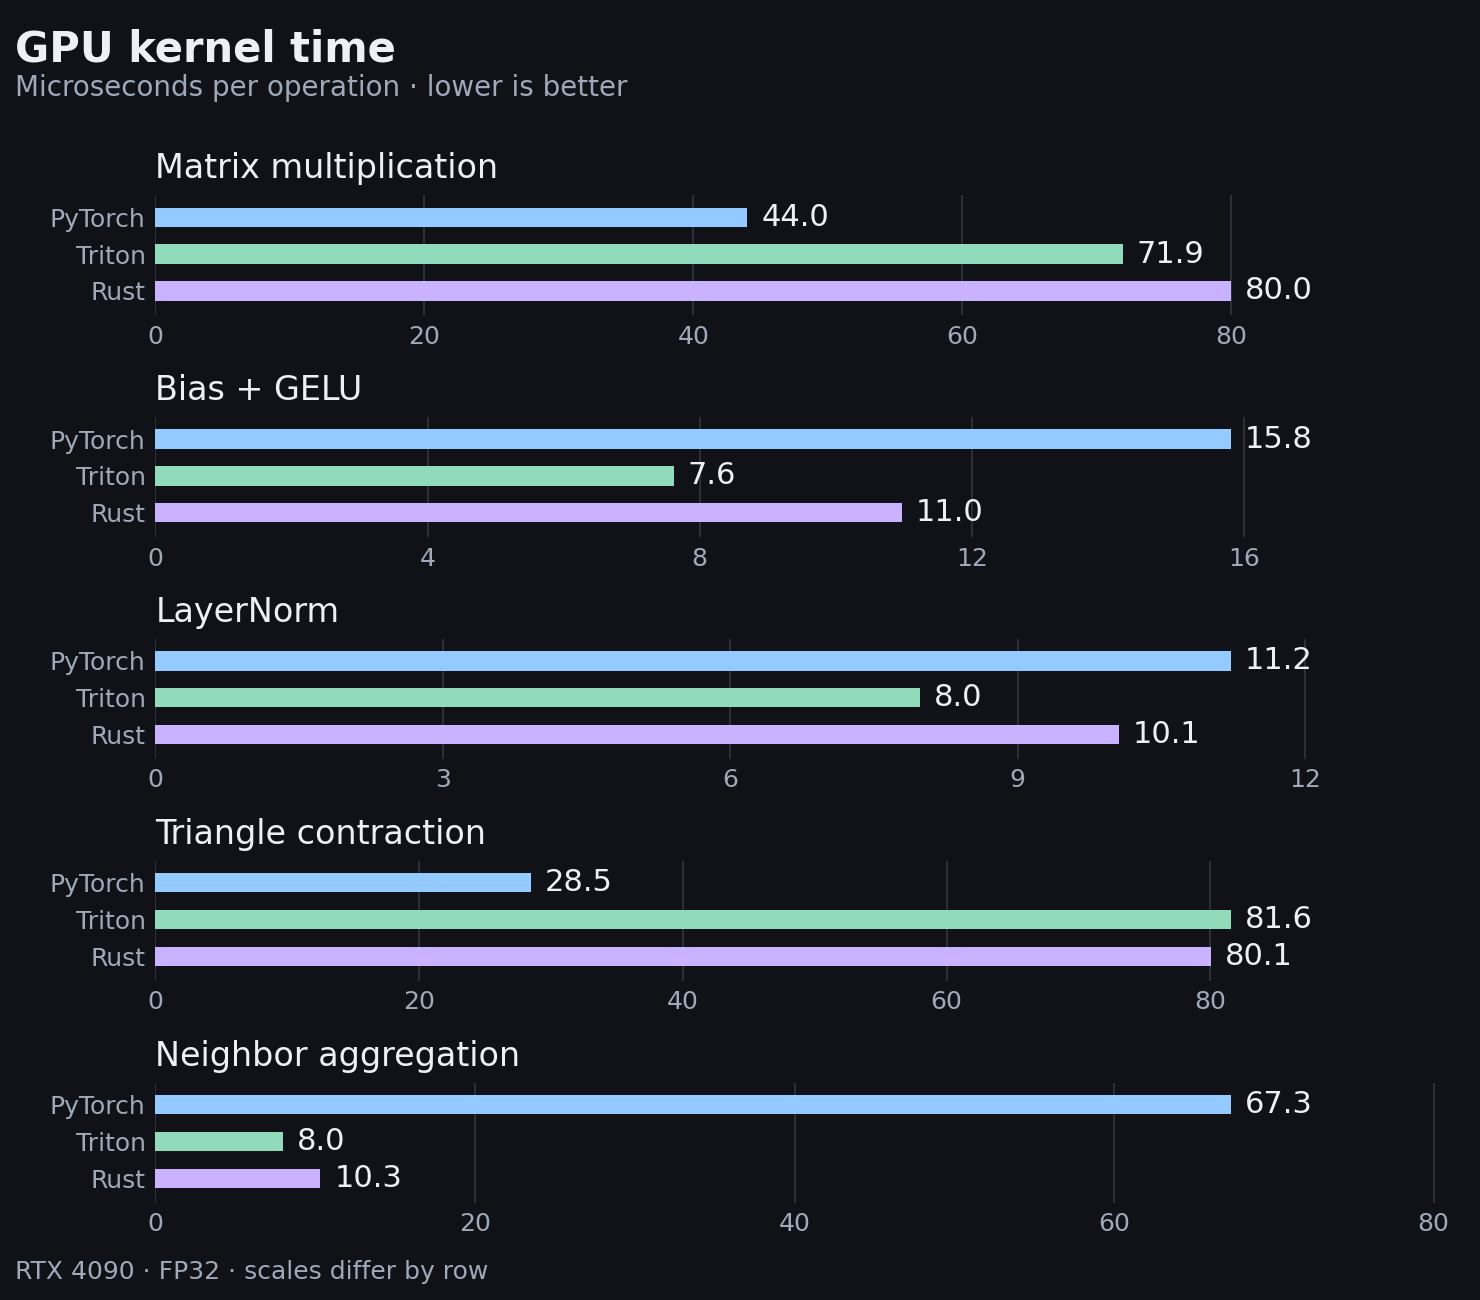
GPU kernel time for all five operations and all three implementations:

GPU kernel time, summed per operation. Separate Nsight Systems capture, 100 iterations per measurement; gaps between launches are excluded. The WSL timestamp fallback has reduced precision.
Read the plotted values (µs)
| Operation | PyTorch | Triton | Rust |
|---|---|---|---|
| Matrix multiplication | 44.0 | 71.9 | 80.0 |
| Bias + GELU | 15.8 | 7.6 | 11.0 |
| LayerNorm | 11.2 | 8.0 | 10.1 |
| Triangle contraction | 28.5 | 81.6 | 80.1 |
| Neighbor aggregation | 67.3 | 8.0 | 10.3 |
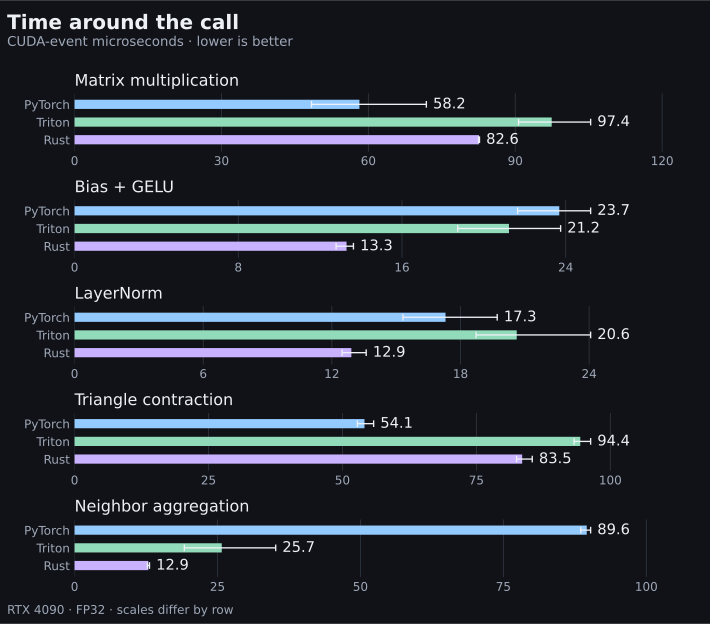
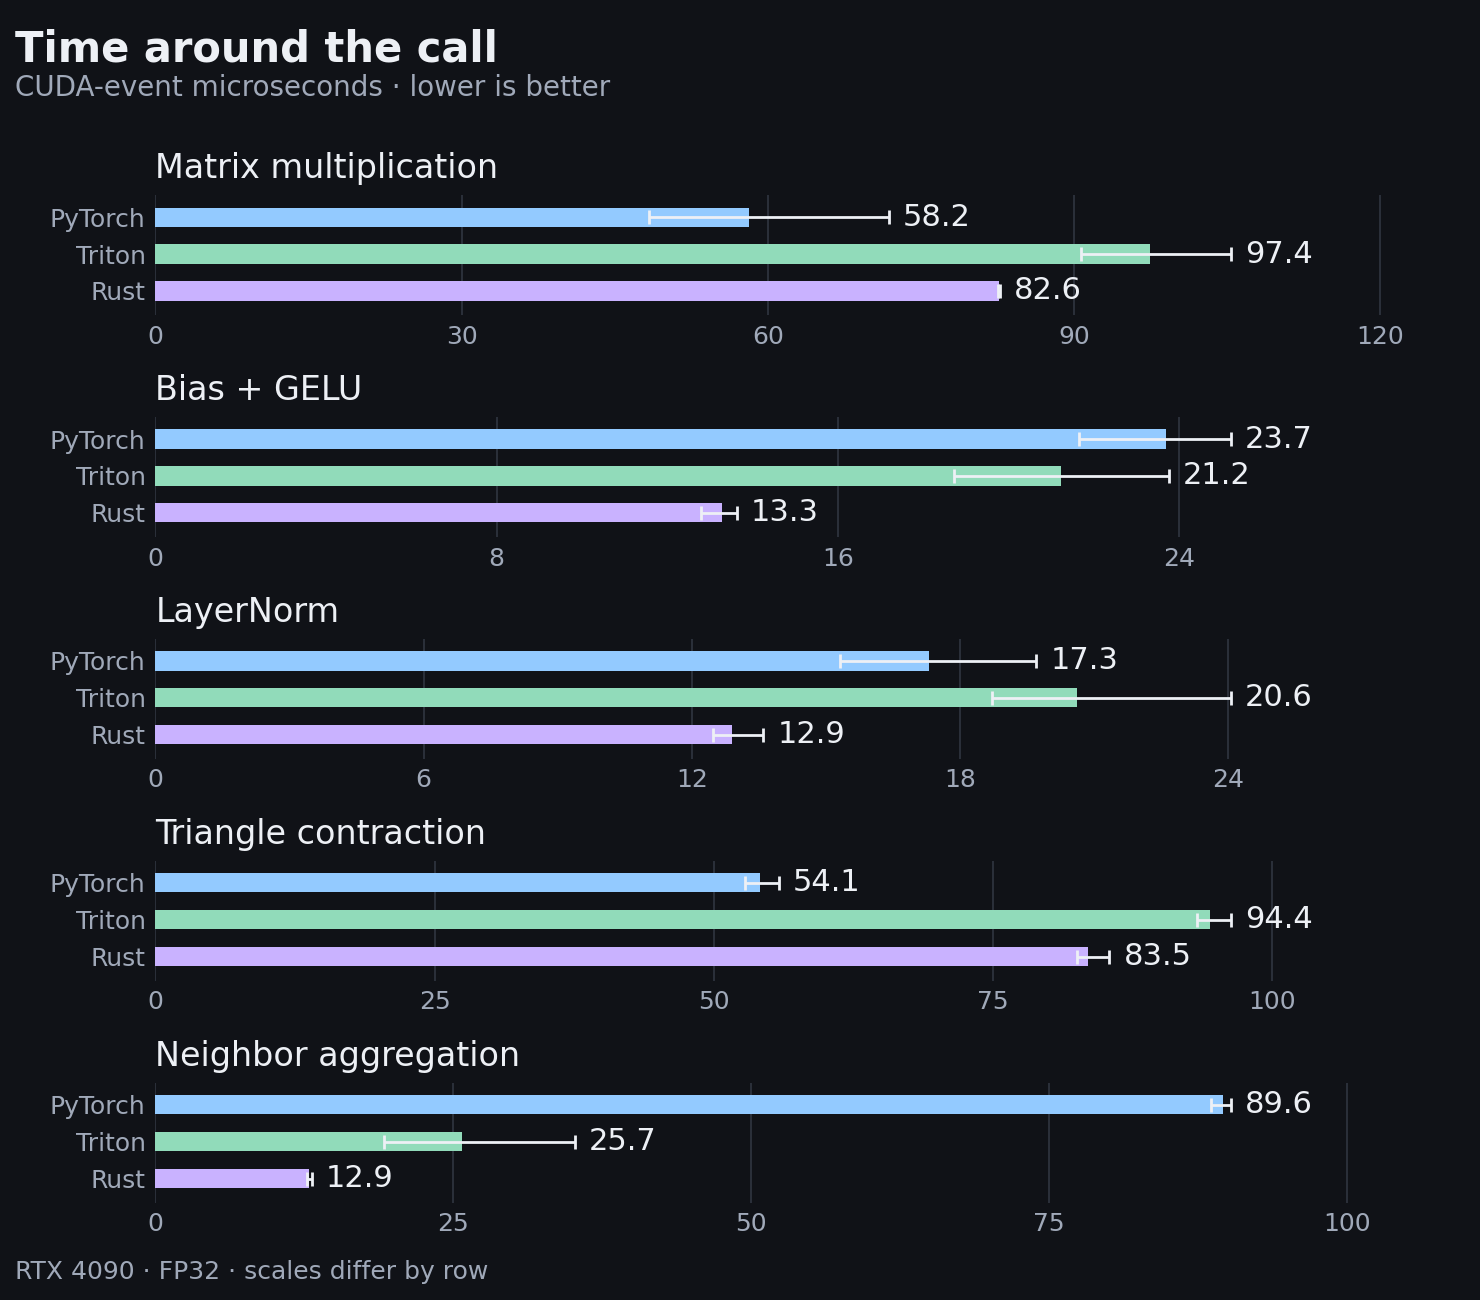
Time around the call:

Mean of 300 warmed CUDA-event spans, collected in three rounds with rotating implementation order. Whiskers show the range of the three round means, not a confidence interval. A span can include gaps while the host submits work.
Read the plotted values (µs)
| Operation | PyTorch | Triton | Rust |
|---|---|---|---|
| Matrix multiplication | 58.2 | 97.4 | 82.6 |
| Bias + GELU | 23.7 | 21.2 | 13.3 |
| LayerNorm | 17.3 | 20.6 | 12.9 |
| Triangle contraction | 54.1 | 94.4 | 83.5 |
| Neighbor aggregation | 89.6 | 25.7 | 12.9 |
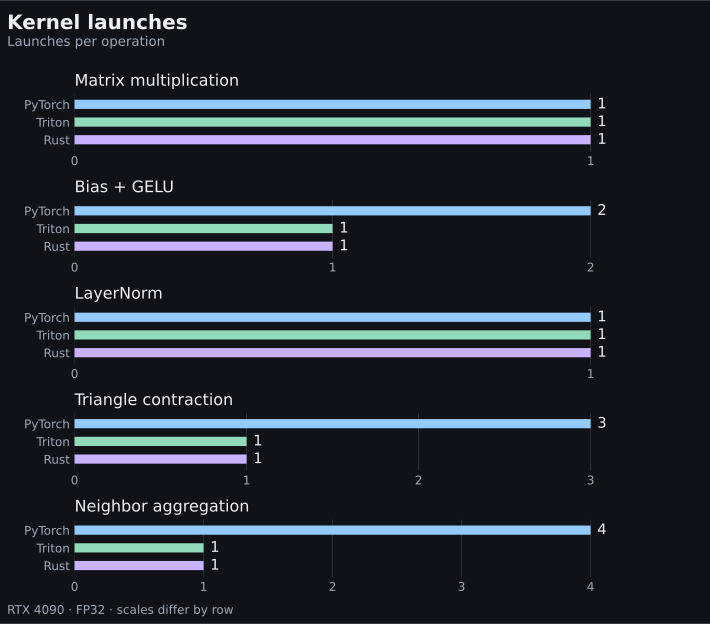
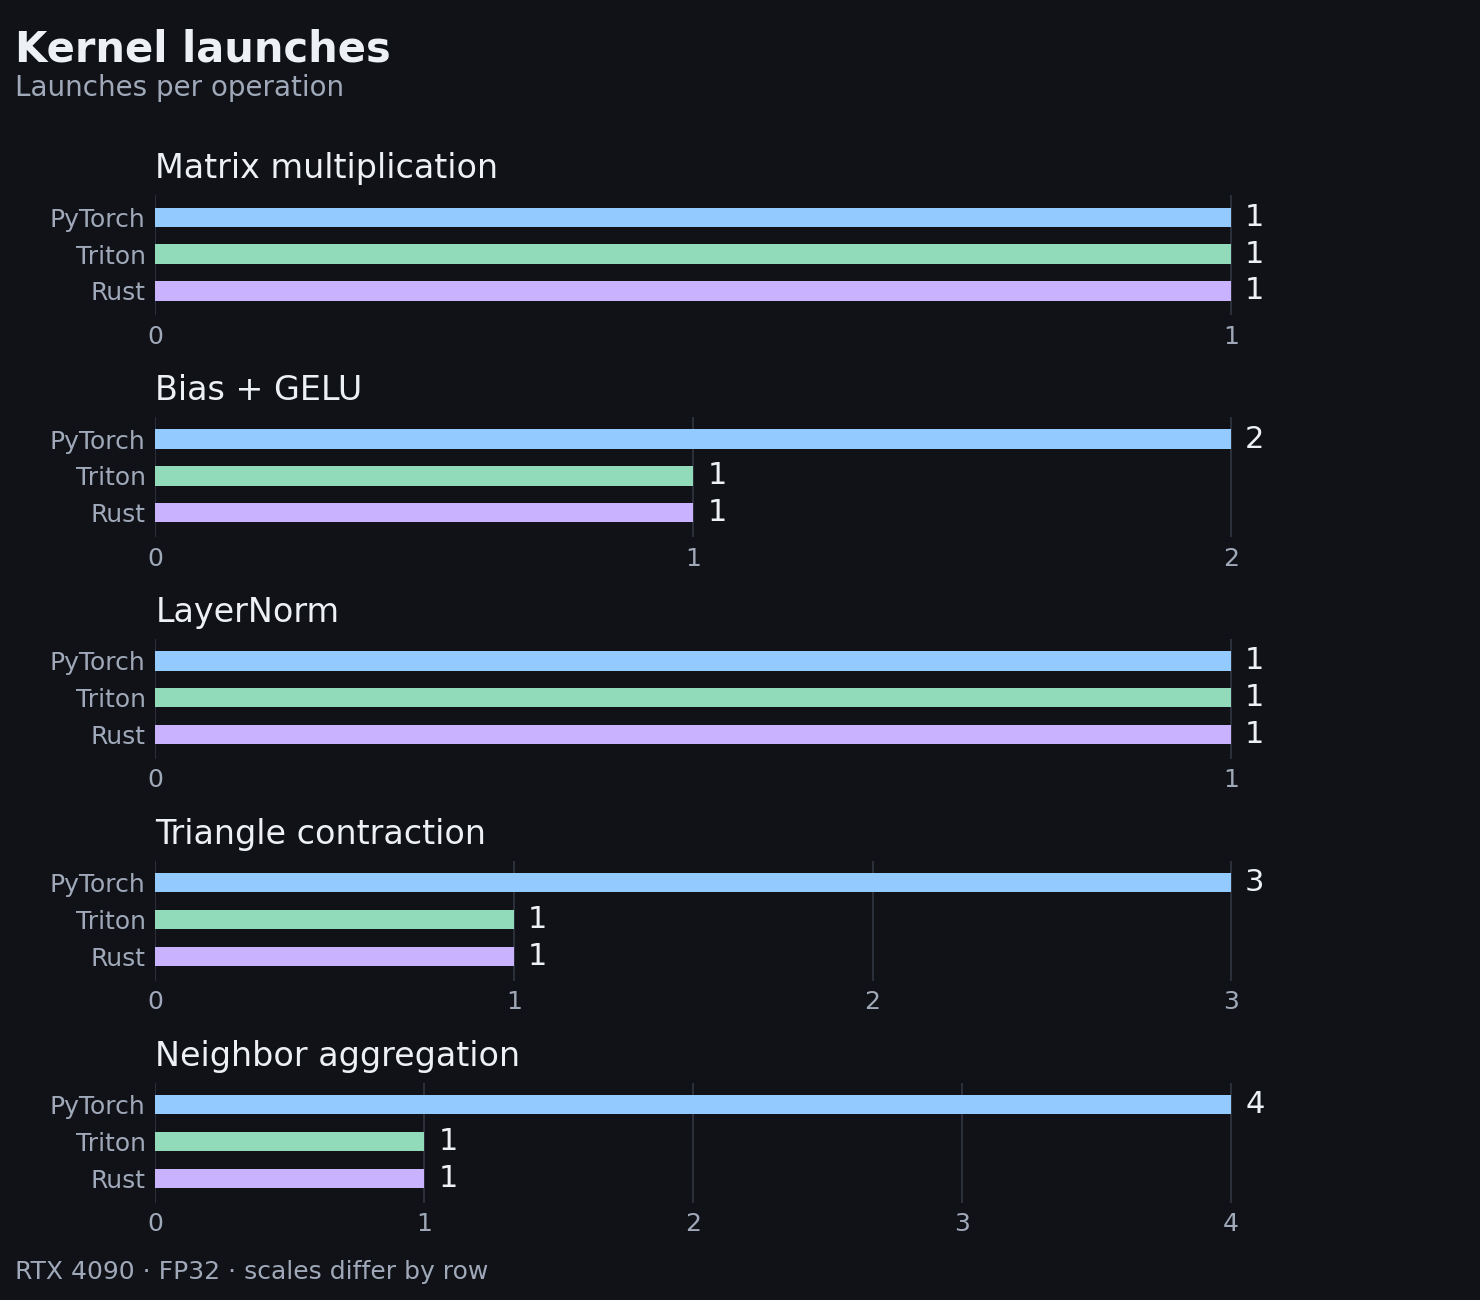
Kernel launches:

Captured launches divided by 100 iterations. Both custom implementations use one kernel per operation. Fewer launches explain part of the result; they do not determine kernel duration.
Read the plotted values
| Operation | PyTorch | Triton | Rust |
|---|---|---|---|
| Matrix multiplication | 1 | 1 | 1 |
| Bias + GELU | 2 | 1 | 1 |
| LayerNorm | 1 | 1 | 1 |
| Triangle contraction | 3 | 1 | 1 |
| Neighbor aggregation | 4 | 1 | 1 |
The unchanged operations bound the drift
Bias + GELU, triangle contraction and neighbor aggregation keep their original kernels. Between the mage-001 and mage-003 namespaces their GPU kernel time moves by less than 3%: 11.21 → 10.97 µs (−2.1%), 81.16 → 80.07 µs (−1.3%), and 10.28 → 10.33 µs (+0.5%). Those three numbers bound how much of the two rewritten kernels’ movement could be environment drift rather than the rewrites.
Attempts that were measured and not adopted
Every entry is a single-run development measurement, not retained evidence, and the metric is named because the entries were not all taken with the same instrument.
| Attempt | Metric | Value | Compared with |
|---|---|---|---|
| matrix multiply, 32 × 32 tiles, 2 × 4 register tile | CUDA-event span | 210.51 µs | 145.61 µs for the retained 4 × 4 build, same session |
| matrix multiply, 8 × 4 register tile on 128-row blocks | CUDA-event span | 147.74 µs | 145.61 µs for the retained 4 × 4 build, same session |
| LayerNorm, 128-thread blocks (four rows per block) | CUDA-event span | 14.4 µs | 12.69 µs for the two-warp build, five runs |
| LayerNorm, row staged in shared memory for a single global pass | CUDA-event span | 14.3 µs | 12.69 µs for the two-warp build, five runs |
| LayerNorm, row held in eight named quad registers | CUDA-event span | 13.4–14.0 µs | 12.69 µs for the two-warp build, five runs |
| LayerNorm, four warps per row | CUDA-event span | 13.3–13.7 µs | 12.69 µs for the two-warp build, five runs |
LayerNorm, row held in a [F32x4; 8] array |
GPU kernel time | 22.12 µs | 11.02 µs for the warp kernel, same build |
The first row is the discriminating experiment of the section above: its ratio to the retained build is what identified shared-memory load instructions as the limit. The second row is inside the few percent this harness cannot resolve. The last row is a regression: the array holding the row per thread spilled to local memory, which is why the row is spread across lanes instead. The two four-warp and shared-staging variants are slower than the retained two-warp build, so the two-warp split is kept.
Limits
- The library call is still ahead. Matrix multiplication is 80.0 µs of kernel time against 44.0 µs for the cuBLAS call behind PyTorch in this capture; across the three namespaces that call ranges from 44.03 to 55.96 µs.
- The Triton matrix multiply is not stable between sessions. Its kernel time is 83.78 µs in
mage-001, 83.77 µs in one later capture and 71.94 µs in the retainedmage-003capture, while the Rust kernel moves from 80.12 µs to 80.00 µs over the same span. In one session Triton is faster and in the other slower, so no ranking between the two follows from a single pairing. The event spans are wider than that difference: Rust measures 82.6 µs in both recent sessions, Triton 88.8 to 97.4 µs across the three. - Layer normalization is behind Triton’s kernel and ahead of both baselines around the call. Its kernel time is 10.05 µs against Triton’s 7.99 µs and PyTorch’s 11.23 µs, while its event span of 12.91 µs is below Triton’s 20.62 µs and PyTorch’s 17.30 µs.
- No counters. Nsight Compute counters are unavailable on this host, so occupancy, cache-hit rates and memory throughput are not measured; the residency arithmetic above is a limit on what the grid can hold, not a measurement of what it held. One WSL workstation with unlocked clocks.
- One capture per case. Kernel time comes from a single Nsight Systems capture per implementation and operation and carries no interval of its own; the event spans are means of 300 samples over three rounds. The two views come from separate runs with different launch rhythms.
- Scope. These are forward-only learning kernels at five fixed FP32 shapes. Compilation, transfers, tile tails, lower precision, backward passes and end-to-end service behavior are outside the measurements.
Method and reproduction
The harness is unchanged from the earlier notes: examples/oxide/comparison.py collects the CUDA-event spans, profile_suite.py captures the kernels with Nsight Systems, and export_comparison.py writes the retained evidence and rewrites each capture directory relative to the checkout. The run that produced this namespace wrote artifacts/mage-004-final and artifacts/mage-004-nsys; the published evidence is comparison-results.json and comparison-profiles.json.
.venv/bin/python examples/oxide/comparison.py --output artifacts/mage-004-final
.venv/bin/python examples/oxide/profile_suite.py \
  --inputs artifacts/mage-004-final --output artifacts/mage-004-nsys \
  --languages python triton rust
.venv/bin/python examples/oxide/export_comparison.py \
  --events artifacts/mage-004-final --profiles artifacts/mage-004-nsys --experiment mage-003
uv run --script scripts/plot-comparison.py --experiment mage-003
uv run --script scripts/plot-kernel-progression.py --experiment mage-003
plot-comparison.py reads the committed evidence, validates the sample counts and correctness flags, and writes the four standard views with their mobile variants, downloadable PNGs and the value table used above. plot-kernel-progression.py documents the six stage values in the field note, checks the five that exist in a committed namespace against it, and writes the progression figure. The pages need only the committed files.
Measurements and reproduction in GitHub · The first field note · The second field note