Field note 002 / Mathematics on a GPU
Keeping values close to the arithmetic
Two Rust kernels restructured so values stay in registers and partial answers meet inside a warp, with the measured kernel time before and after and the unchanged operations as controls.
The first comparison left five operations with three implementations each and no clear winner. Two of the Rust kernels were slower than the alternatives for a reason the source made visible: layer normalization sent every partial sum through shared memory and barriers, and matrix multiplication computed one output per thread from shared tiles. Both spend time on work the arithmetic does not require.
This note records the two rewrites, keeps the earlier measurements beside the new ones, and treats the three untouched operations as controls. The measured revision is the state merged as the kernel rewrite; field note 001 holds the first comparison, and the journal entry for this work is Rewriting the layer norm and matmul kernels.
A reduction has to meet somewhere
Layer normalization reduces each row twice:
\[\mu_i=\frac{1}{d}\sum_{j=1}^{d}x_{ij}, \qquad \sigma_i^2=\frac{1}{d}\sum_{j=1}^{d}\left(x_{ij}-\mu_i\right)^2 .\]Both reductions end in a single value per row, so the threads holding partial answers must combine them. The earlier layer_norm kernel gave each row a block of 256 threads, wrote one partial sum per thread into shared memory, and halved the block through five barriers until one value remained. The arrangement is correct and it forces every thread of the block to wait at each step.
The new layer_norm_warp kernel assigns one warp to a row. Thirty-two lanes read the row in 128-bit quads — four consecutive floats per load — and add the four values of each quad into one register. The warp reduces with shuffle_down offsets of 16, 8, 4, 2, and 1, so the partial answers meet inside registers instead of shared memory, and the same structure computes the centered variance. The launch changes with it: 512 blocks of eight warps replace 4096 blocks of one row each.
The captures show the change in the resources the kernel asks for: 0 bytes of shared memory and 40 registers per thread, against 1024 bytes and 27 registers before. Removing the barrier also removes the reason the block had to be sized to a row. layer_norm stays in the file for widths that are not a multiple of four.
A tile decides how often shared memory is read
A matrix product reuses both inputs along its contraction:
\[C_{ij}=\sum_k A_{ik}B_{kj}.\]For one output, a row of $A$ meets a column of $B$. Neighboring outputs reuse parts of that data, which is what a tile makes explicit: a block that owns a 64 × 64 region of $C$ needs 64 rows of $A$ and 64 columns of $B$ but reuses them across the whole region.
The earlier tiled_matmul gave every thread one output from 16 × 16 tiles, so each thread read a full row and column segment of shared memory for every output it produced: 16 shared-memory reads per multiply-add, and 4096 blocks for the 1024 × 1024 × 1024 shape.
The new tiled_matmul_registers keeps a 4 × 4 tile of outputs per thread: 16 accumulators, fed by four values of $A$ and four values of $B$ per step, which is 16 multiply-adds from eight shared-memory reads. The K dimension moves in steps of 32; before each step the block loads its two tiles through 128-bit quads (a 64 × 32 region of $A$ and a 32 × 64 region of $B$) into 16384 bytes of shared memory. The block count falls from 4096 to 256, and registers per thread rise from 37 to 55.
A deeper K step means fewer barriers: the tile is loaded once per 32 columns of the contraction instead of once per 16. The trade is explicit — more values held per thread, fewer threads resident per unit of shared memory — which is why the kernel keeps the 4 × 4 shape rather than a wider one. The host launches this variant when $m$ and $n$ are multiples of 64 and $k$ of 32, the shape measured here; tiled_matmul covers every other shape, including the edges.
What the captures show
RTX 4090 · FP32 · identical inputs
Rewritten Rust kernels beside mage-001 and the library baselines

Time spent executing GPU kernels, summed per operation in a separate Nsight Systems capture of 100 iterations; gaps between launches are excluded. PyTorch, Triton, and the rewritten Rust kernel come from one capture session. The mage-001 Rust bar is the earlier session.
Each panel has its own scale. Lower is better.
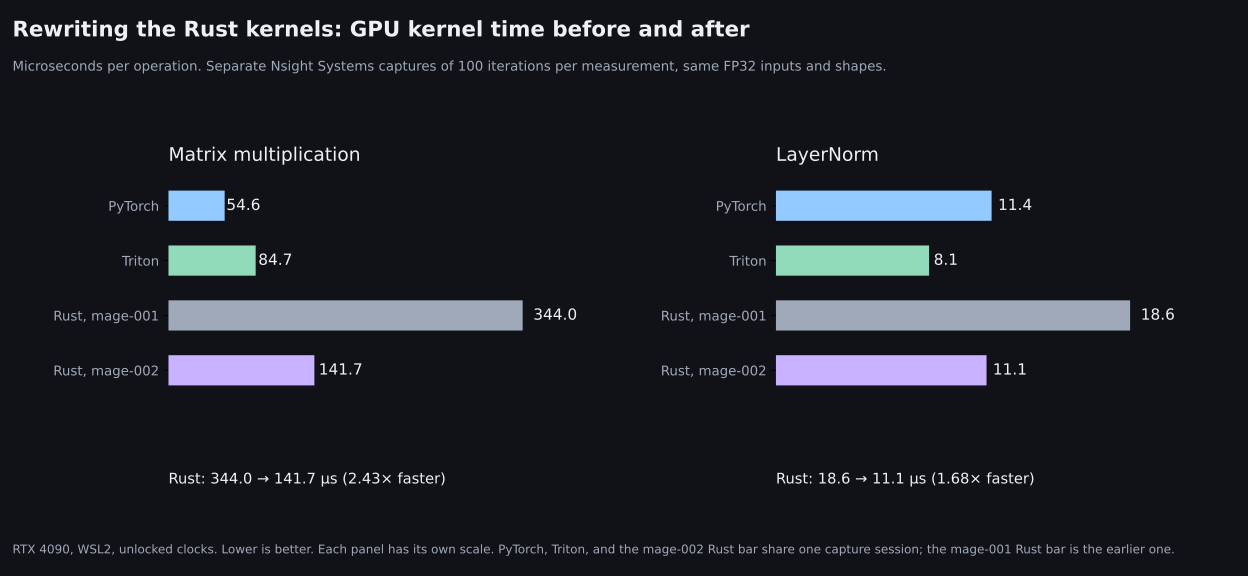
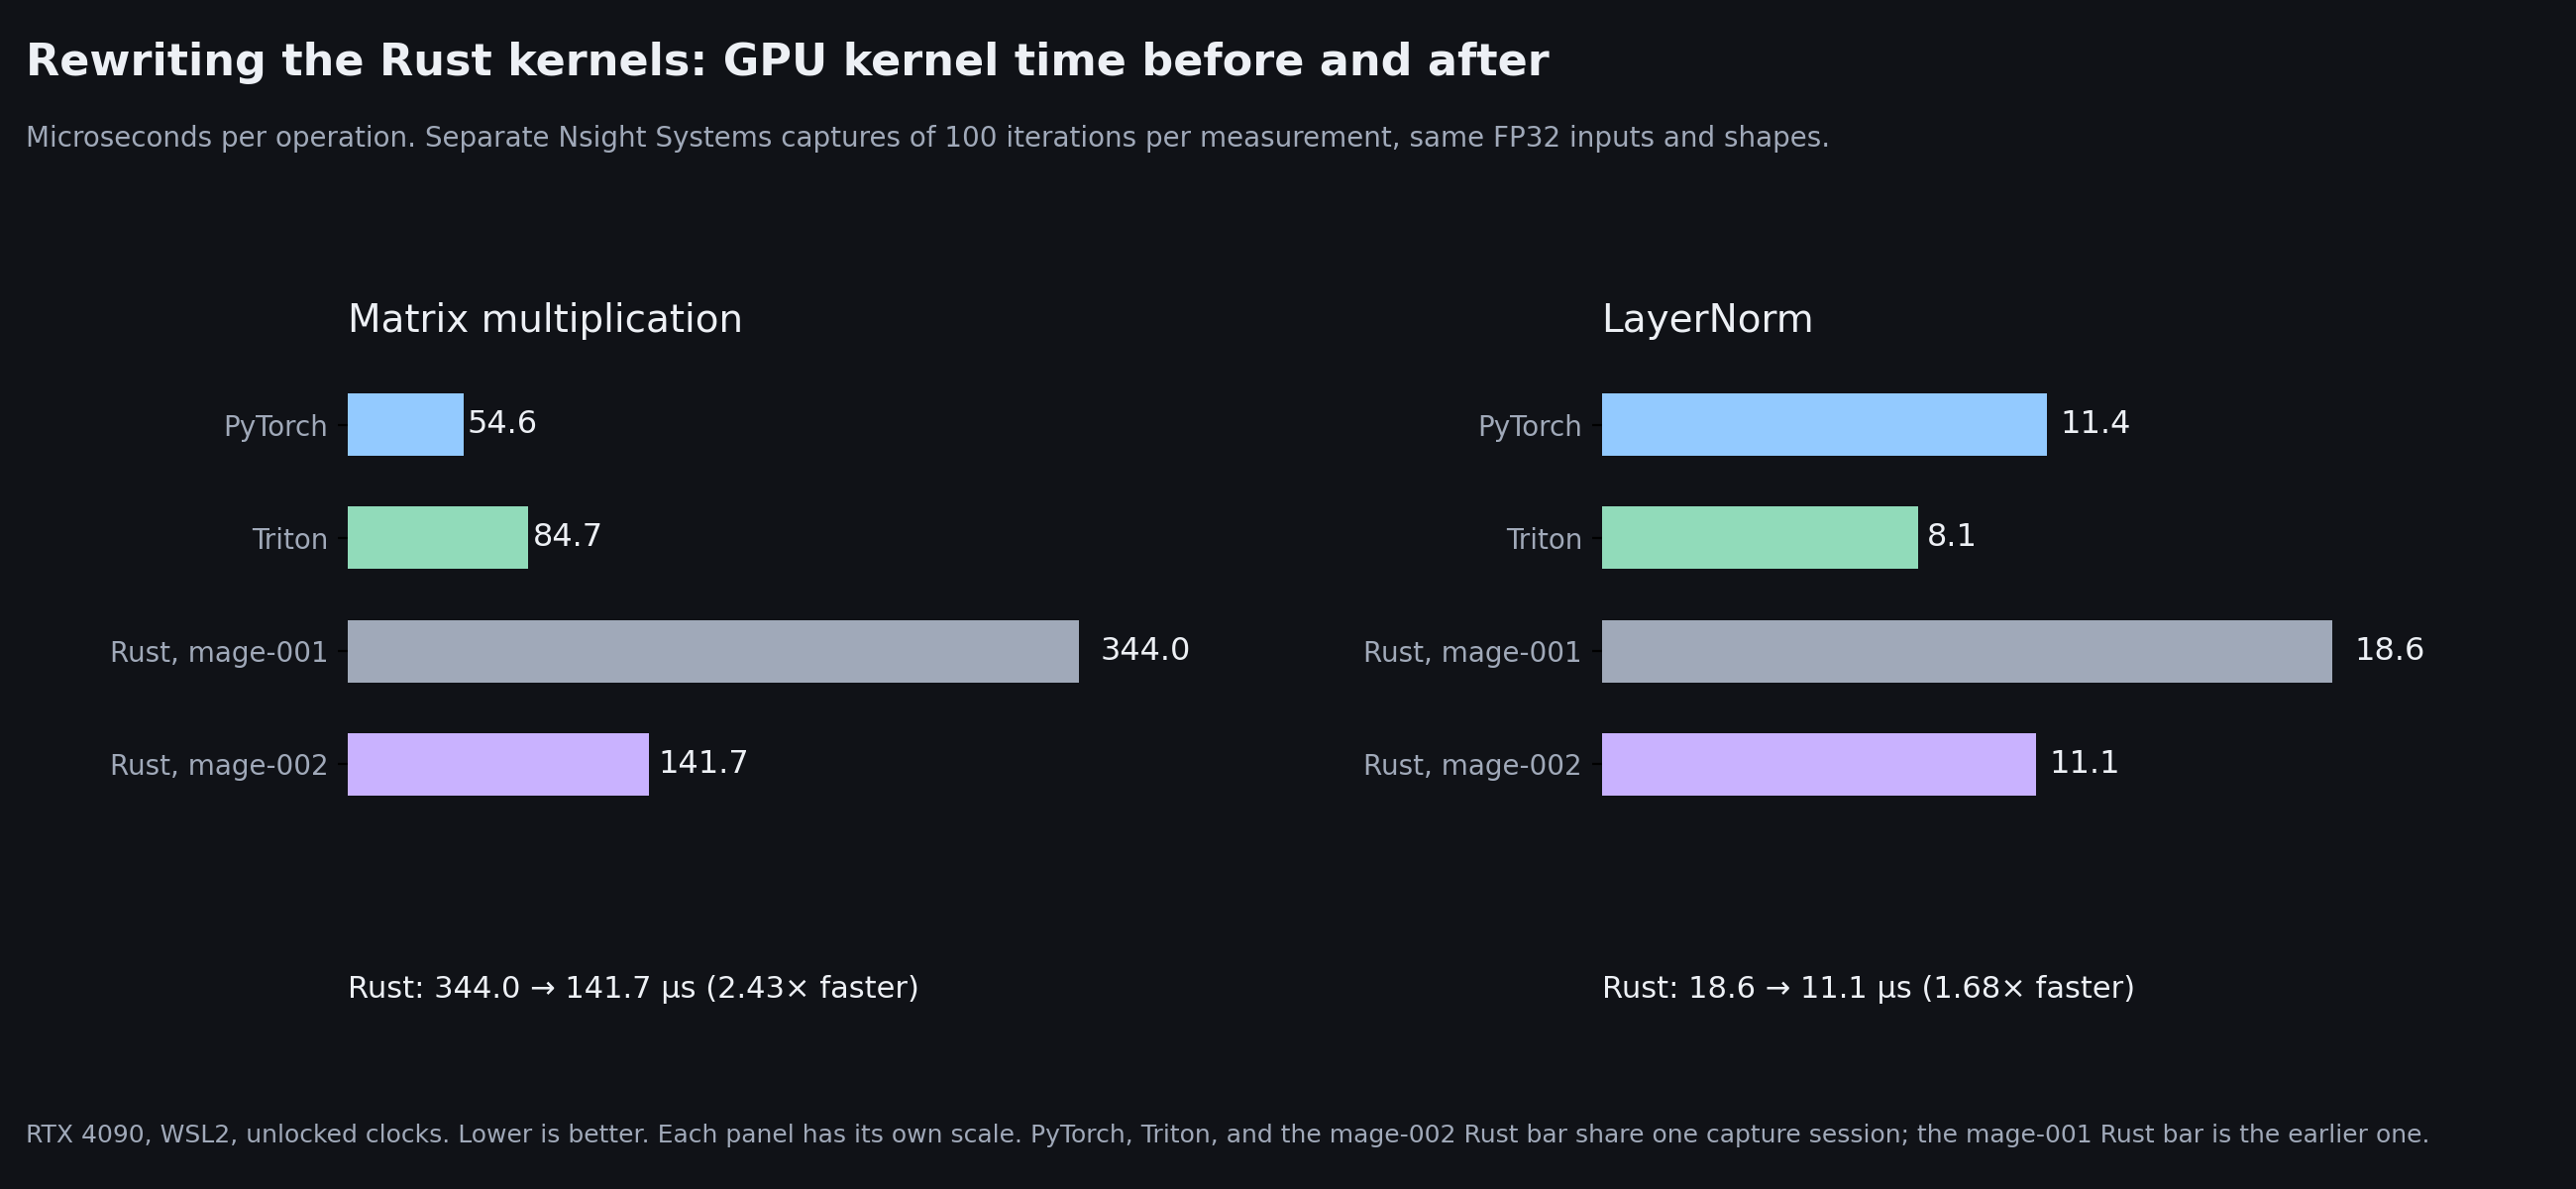
Read the plotted values and the unchanged operations (µs)
| Operation | Rust mage-001 | Rust mage-002 | Change | Status |
|---|---|---|---|---|
| Matrix multiplication | 344.0 | 141.7 | -58.8% | rewritten |
| Bias + GELU | 11.2 | 11.0 | -1.7% | control |
| LayerNorm | 18.6 | 11.1 | -40.5% | rewritten |
| Triangle contraction | 81.2 | 80.4 | -0.9% | control |
| Neighbor aggregation | 10.3 | 10.3 | 0.0% | control |

The same picture as in mage-001, measured again in the new capture. Layer normalization and matrix multiplication are the rewritten kernels; the other three are controls.
Each row has its own scale. Compare implementations within a row.
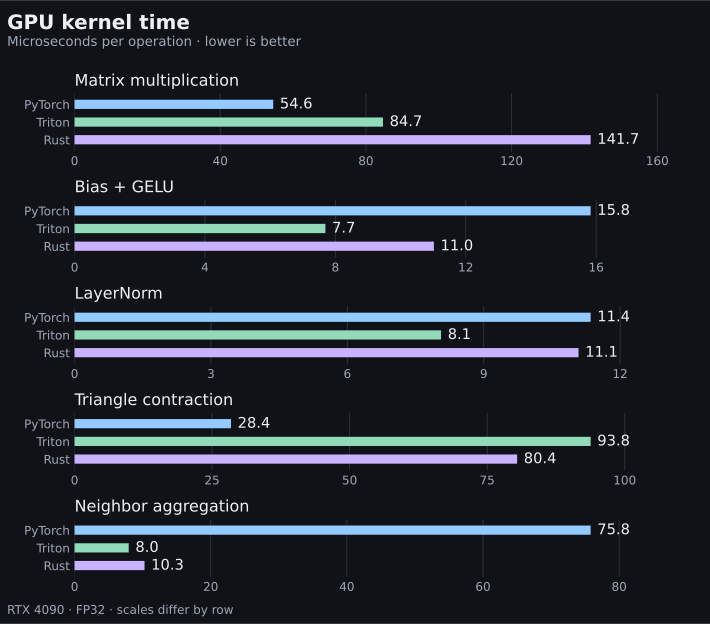
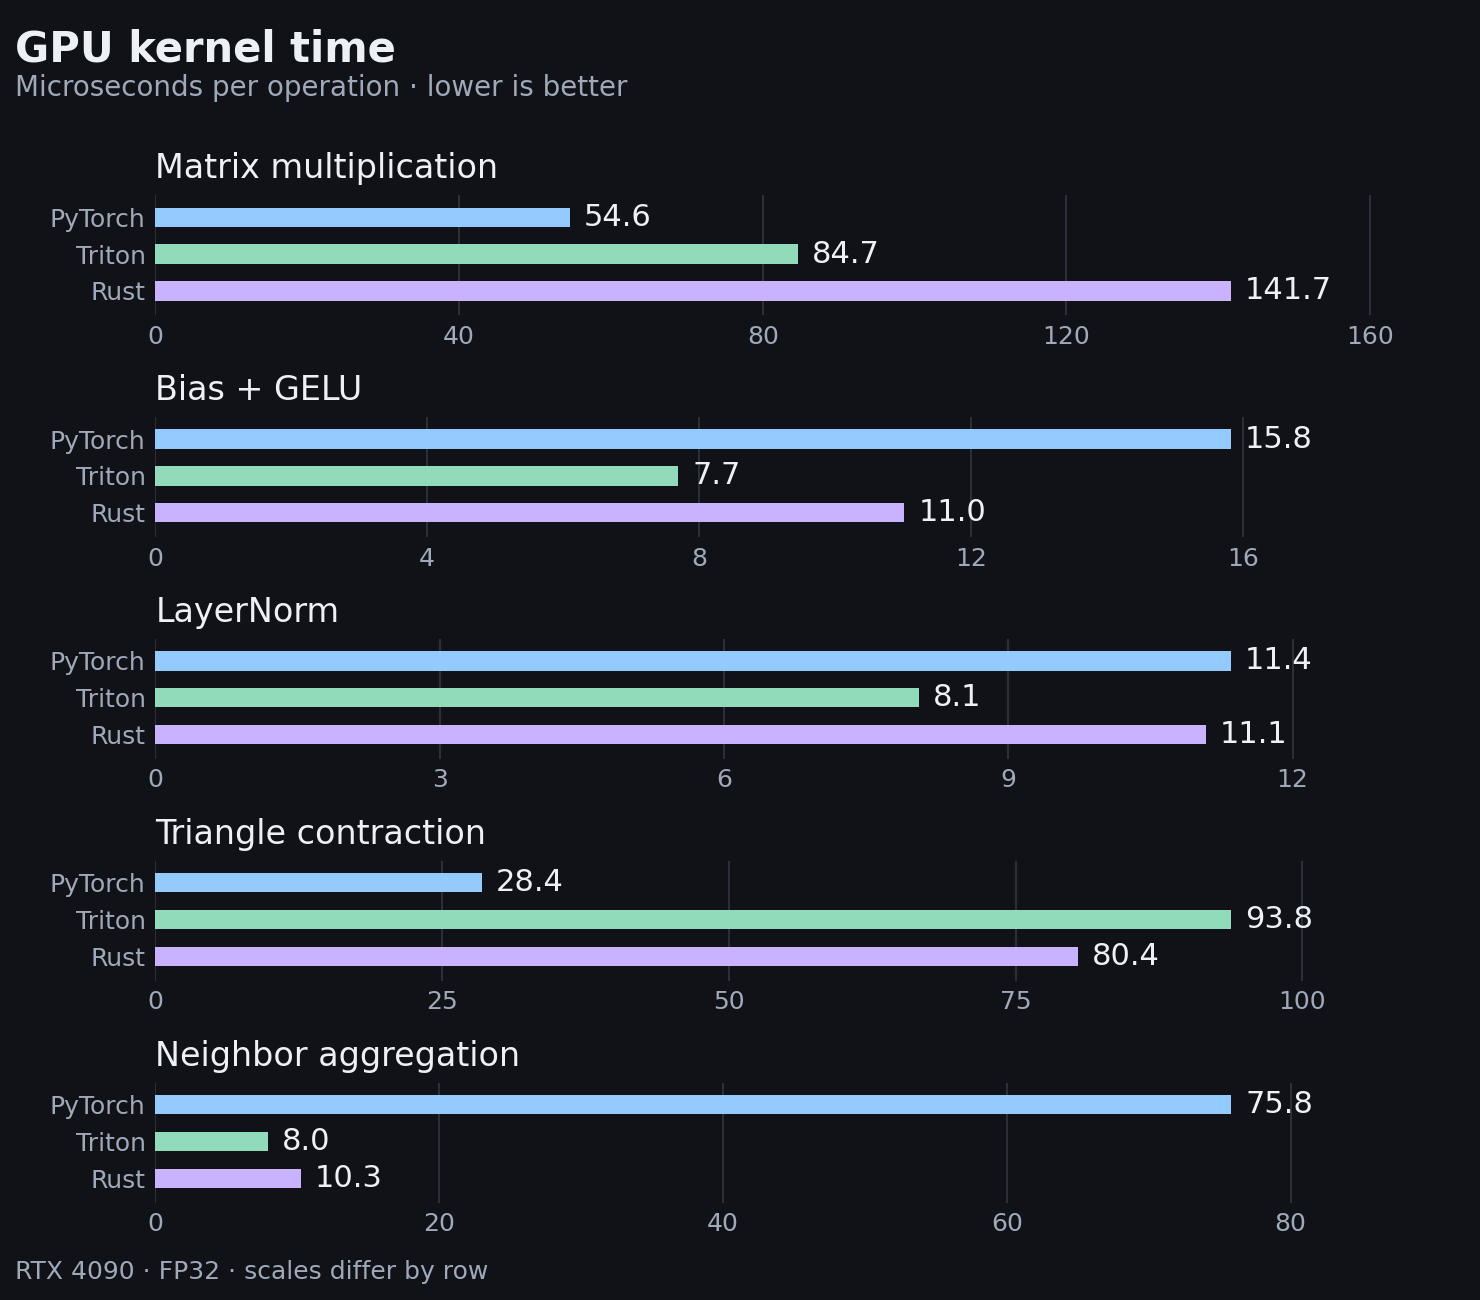
Read the plotted values (µs)
| Operation | PyTorch | Triton | Rust |
|---|---|---|---|
| Matrix multiplication | 54.6 | 84.7 | 141.7 |
| Bias + GELU | 15.8 | 7.7 | 11.0 |
| LayerNorm | 11.4 | 8.1 | 11.1 |
| Triangle contraction | 28.4 | 93.8 | 80.4 |
| Neighbor aggregation | 75.8 | 8.0 | 10.3 |

Mean of 300 warmed CUDA-event spans, collected in three rounds with rotating implementation order. Whiskers show the range of the three round means, not a confidence interval. A span can include gaps while the host submits work.
Each row has its own scale. Compare implementations within a row.
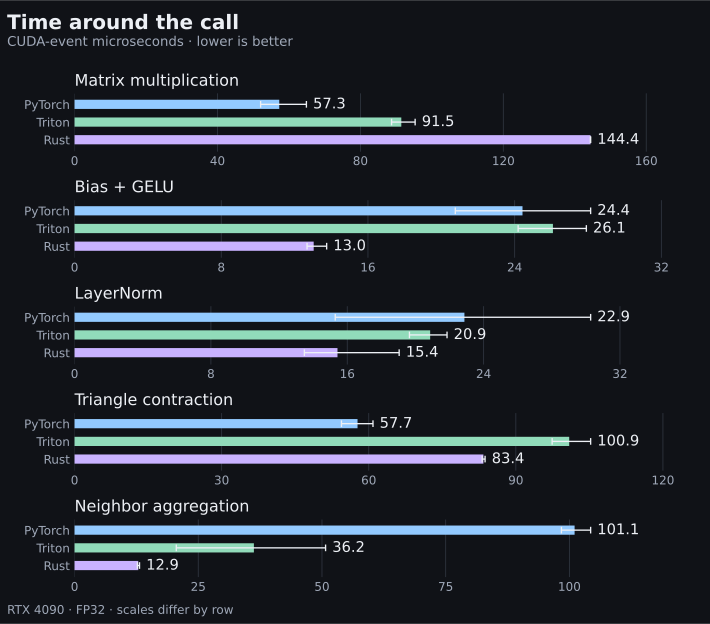
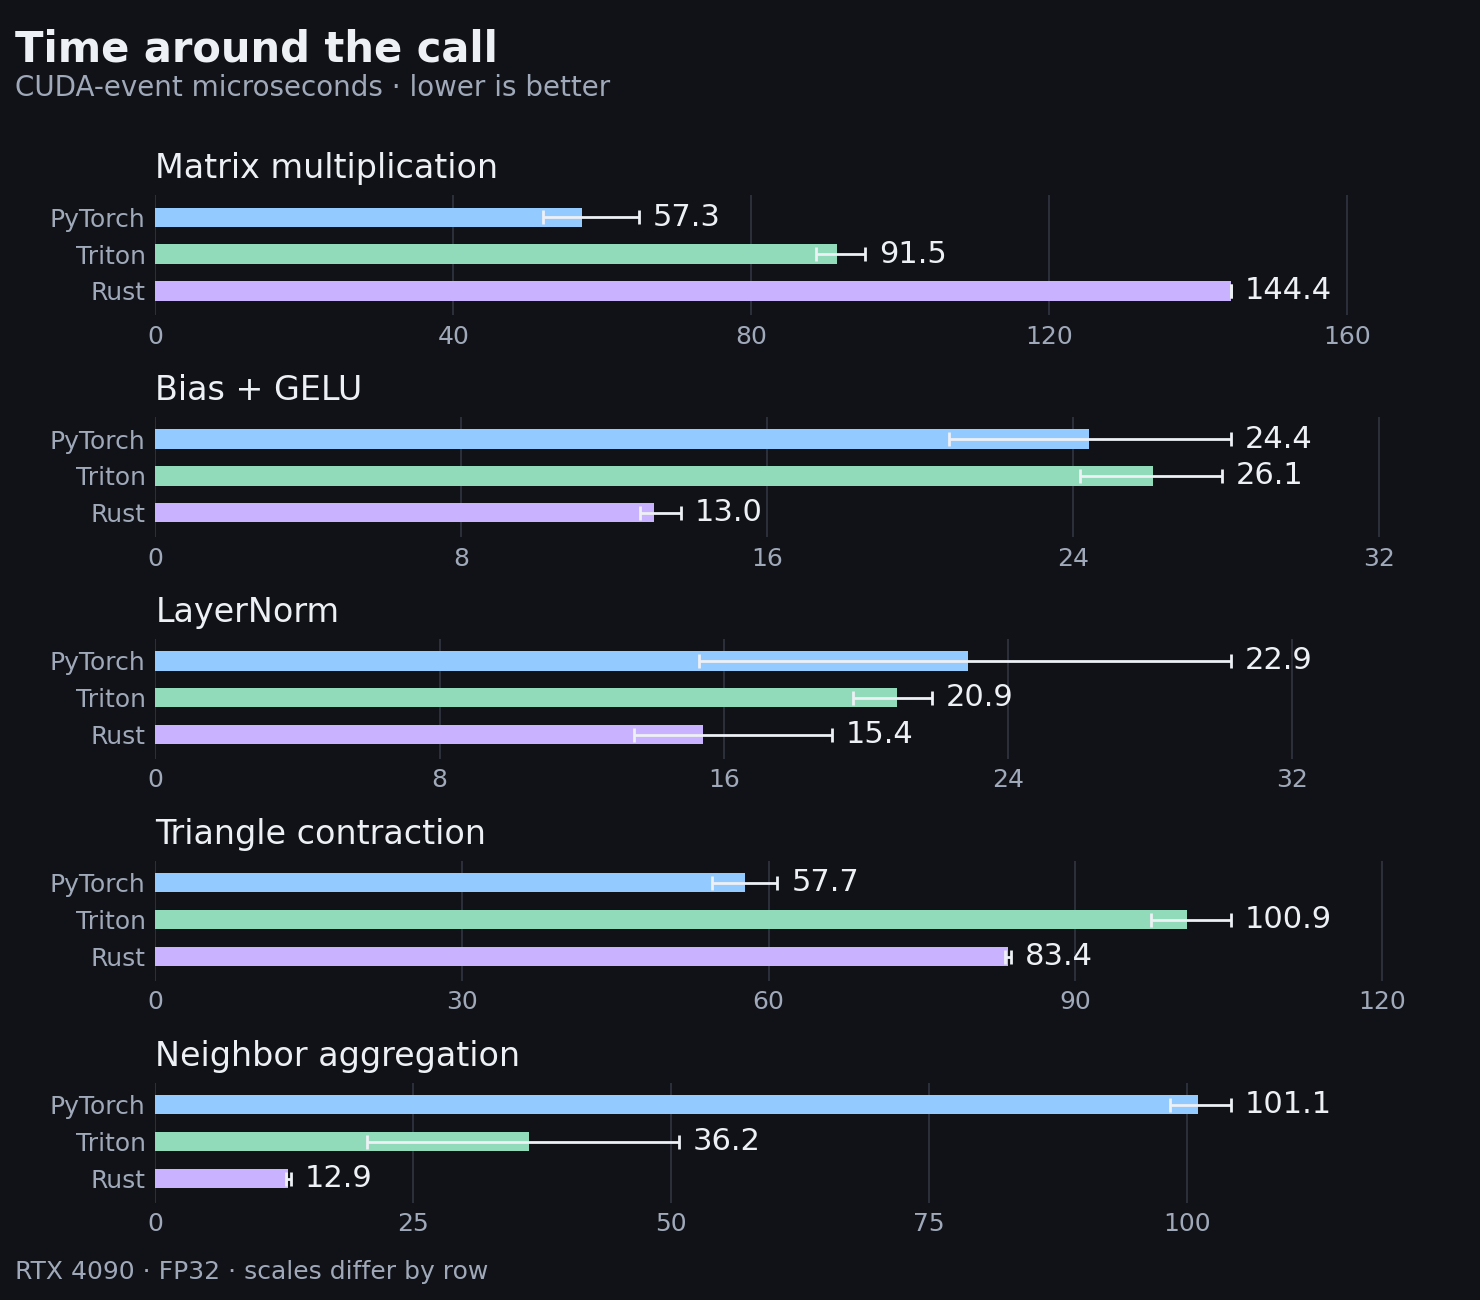
Read the plotted values (µs)
| Operation | PyTorch | Triton | Rust |
|---|---|---|---|
| Matrix multiplication | 57.3 | 91.5 | 144.4 |
| Bias + GELU | 24.4 | 26.1 | 13.0 |
| LayerNorm | 22.9 | 20.9 | 15.4 |
| Triangle contraction | 57.7 | 100.9 | 83.4 |
| Neighbor aggregation | 101.1 | 36.2 | 12.9 |

Captured launches divided by 100 iterations. The counts are unchanged from mage-001: one kernel per custom operation.
Each row has its own scale. Compare implementations within a row.
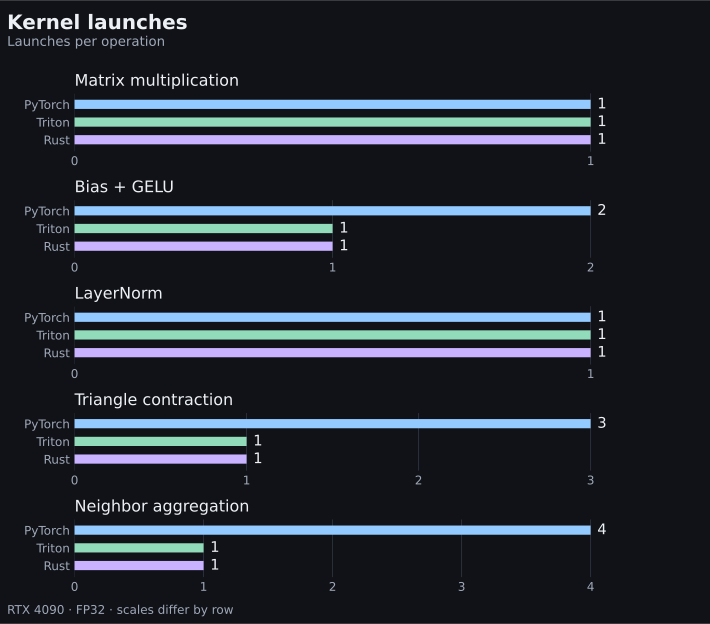
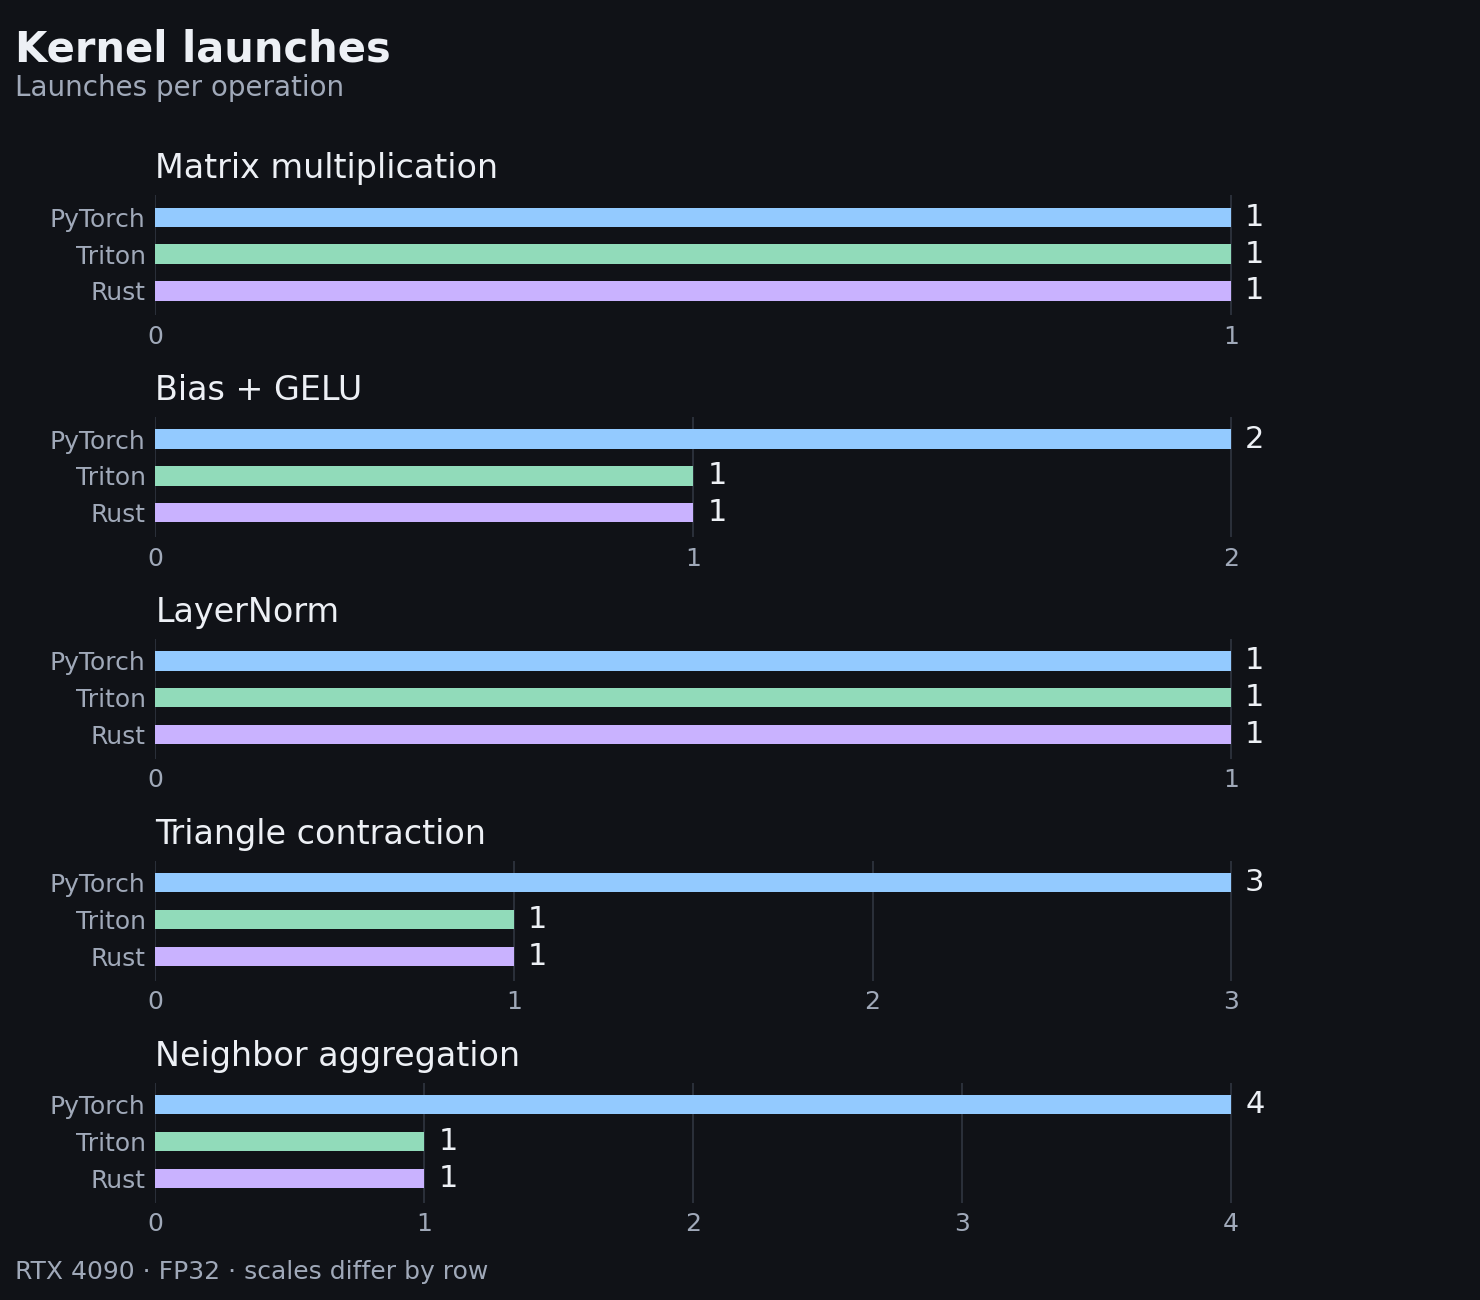
Read the plotted values
| Operation | PyTorch | Triton | Rust |
|---|---|---|---|
| Matrix multiplication | 1 | 1 | 1 |
| Bias + GELU | 2 | 1 | 1 |
| LayerNorm | 1 | 1 | 1 |
| Triangle contraction | 3 | 1 | 1 |
| Neighbor aggregation | 4 | 1 | 1 |

Both views in one figure. The top row is time inside the kernels; the bottom row is time around the call. Each column has its own scale, so implementations compare within a column.
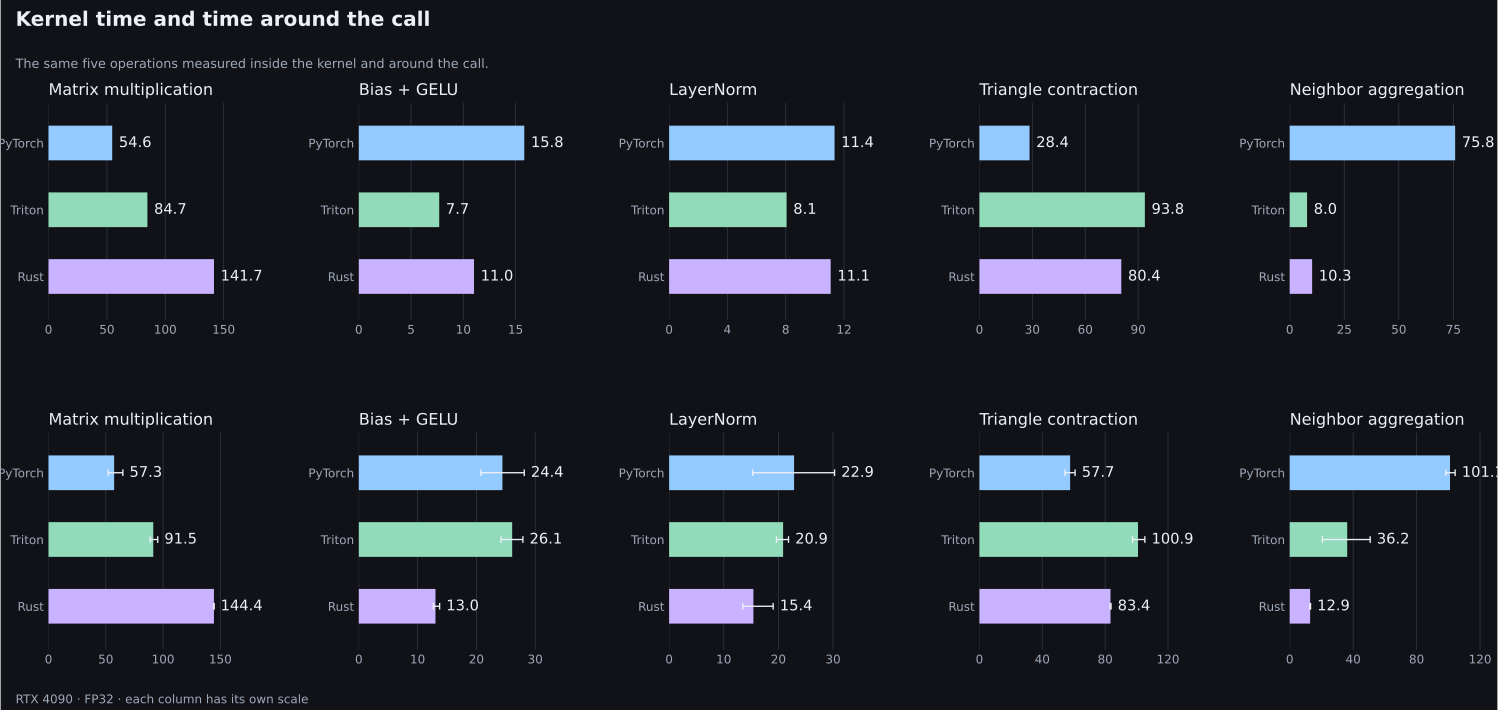
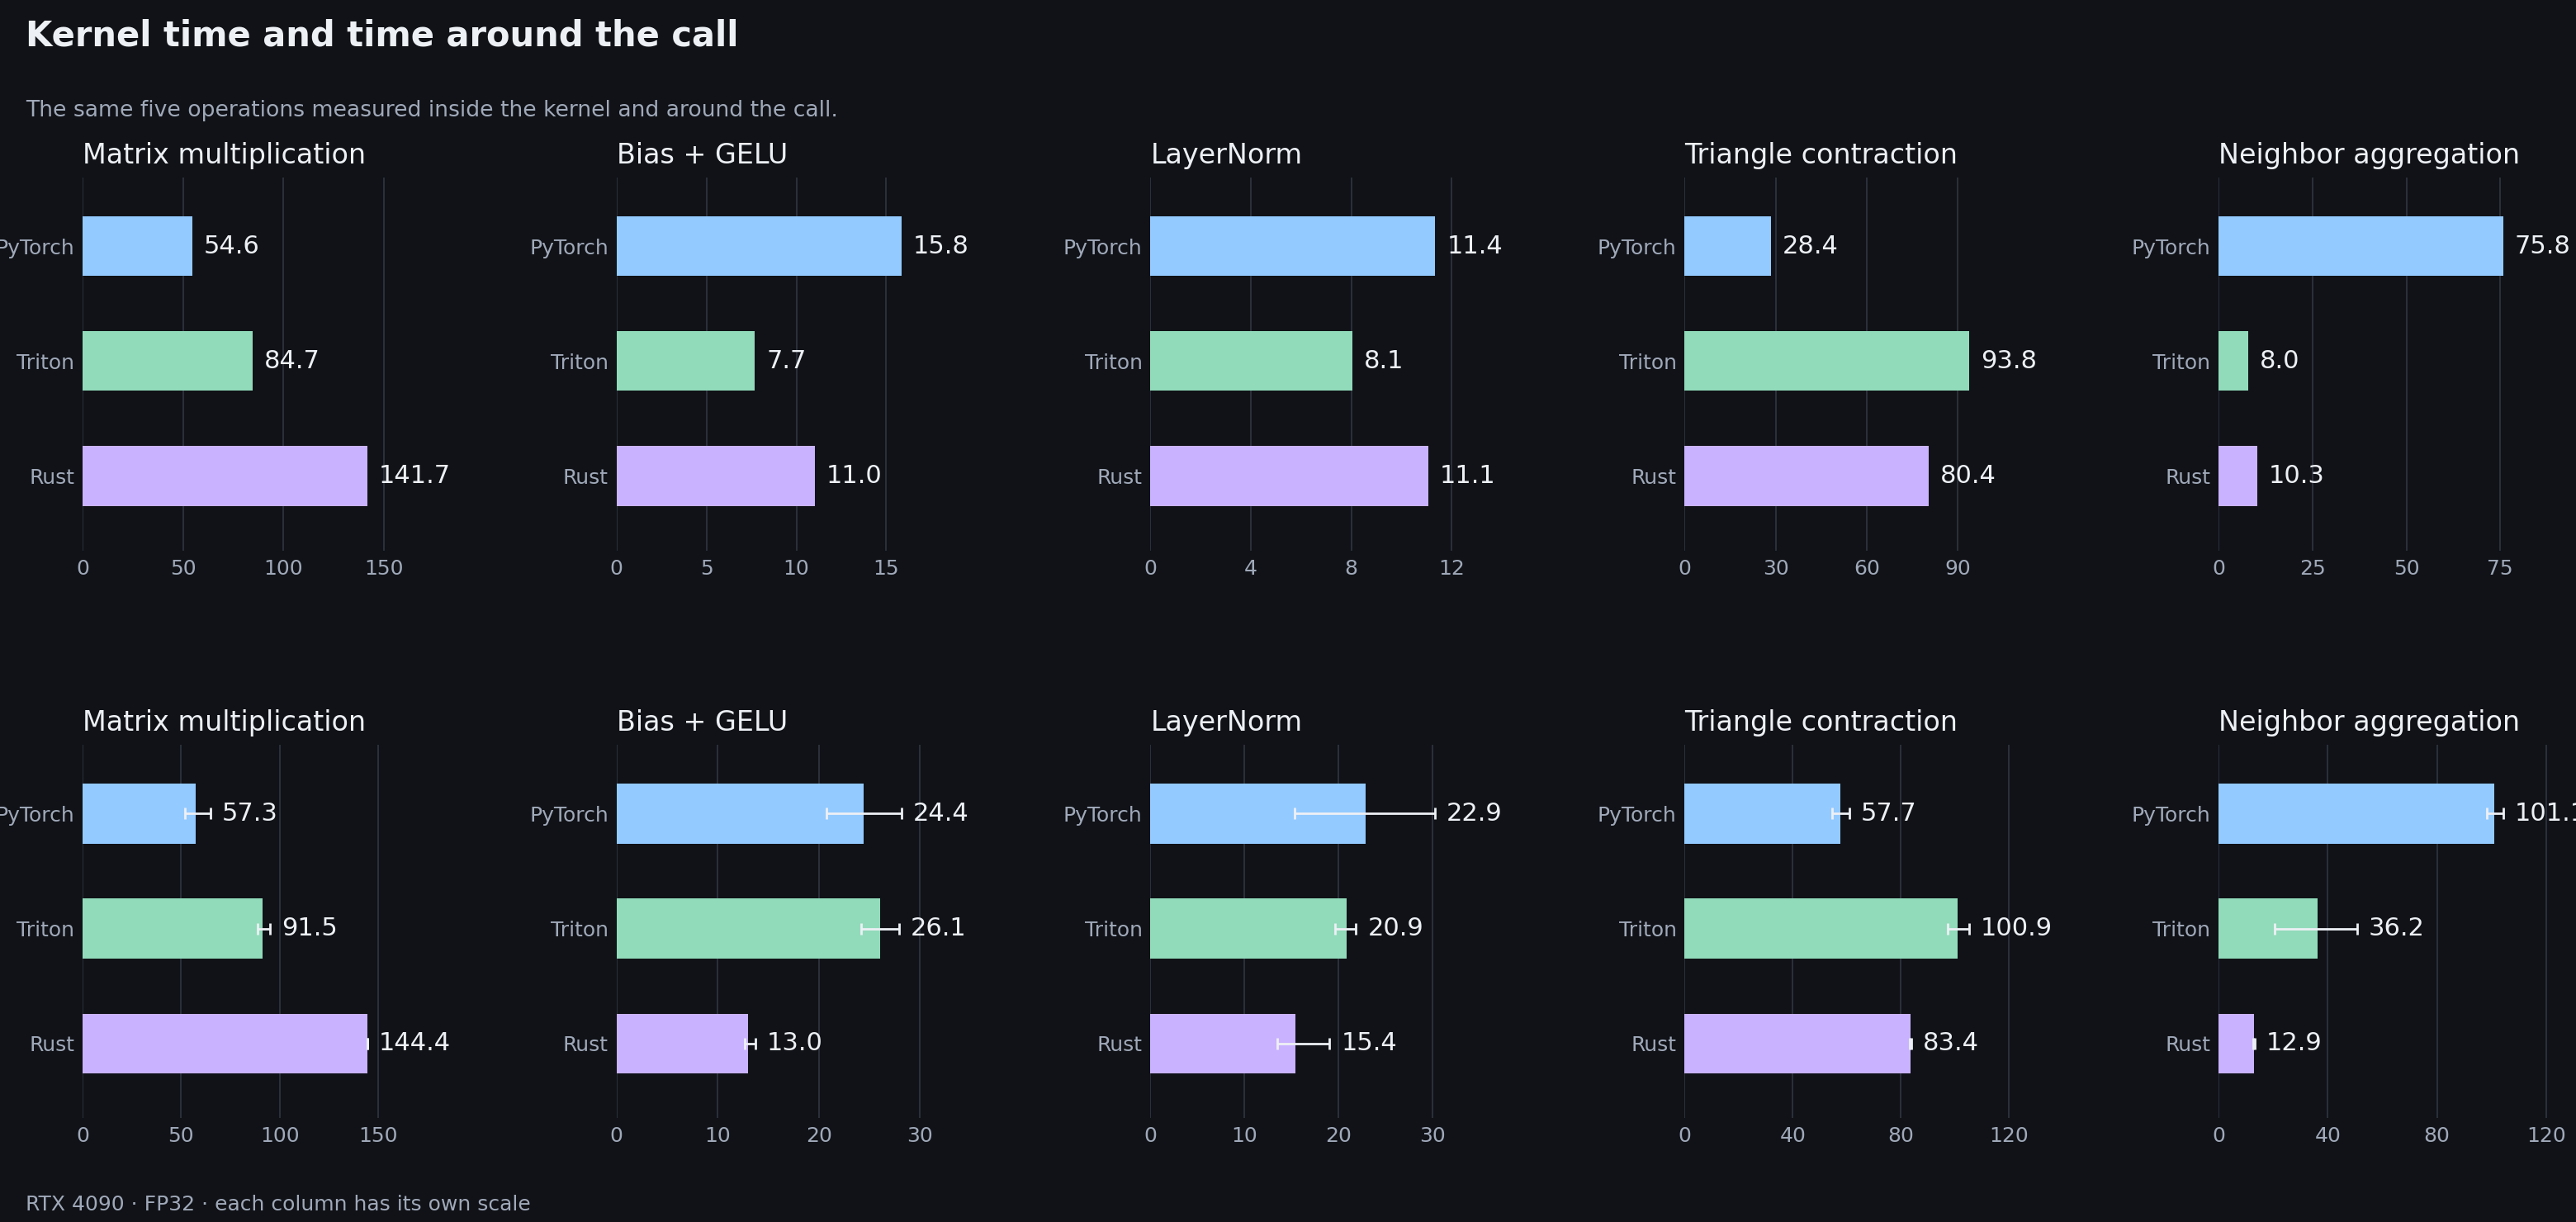
Read the Rust values for both views (µs)
| Operation | Kernel mage-001 | Kernel mage-002 | Span mage-001 | Span mage-002 | Status |
|---|---|---|---|---|---|
| Matrix multiplication | 344.0 | 141.7 | 326.7 | 144.4 | rewritten |
| Bias + GELU | 11.2 | 11.0 | 13.0 | 13.0 | control |
| LayerNorm | 18.6 | 11.1 | 19.5 | 15.4 | rewritten |
| Triangle contraction | 81.2 | 80.4 | 78.5 | 83.4 | control |
| Neighbor aggregation | 10.3 | 10.3 | 13.2 | 12.9 | control |
Forward-only learning kernels at five fixed shapes, on one WSL workstation with unlocked clocks. Compilation, transfers, and service startup are excluded. The three control operations keep their mage-001 kernels, so their measurements show the run-to-run variation of this harness. This is a comparison of these implementations, not a production workload benchmark.
The two rewritten kernels move the Rust numbers closer to the library baselines in the same capture session. Matrix multiplication falls from 344.0 µs to 141.7 µs of GPU kernel time, against 54.6 µs for the library-backed PyTorch call and 84.7 µs for Triton. Layer normalization falls from 18.6 µs to 11.1 µs, against 11.4 µs for PyTorch and 8.1 µs for Triton. The event spans around each call move in the same direction, from 326.7 µs to 144.4 µs and from 19.5 µs to 15.4 µs.
The three operations that keep their earlier kernels — bias + GELU, triangle contraction, and neighbor aggregation — reproduce their mage-001 kernel times within 2%, which is what this harness can resolve between runs. Their CUDA-event spans move further, by up to 66% for Triton’s neighbor aggregation, so the span is the noisier of the two measurements at these durations.
A reduction that once needed a block and now needs a warp is a structural change, and it is the part that can be explained without hardware counters. The kernel time follows it, but the counters that would separate instruction count from memory traffic from occupancy remain unavailable on this host, so the decomposition is not measured.
Method
The harness is unchanged from mage-001: examples/oxide/comparison.py collects the CUDA-event spans, profile_suite.py captures the kernels with Nsight Systems, and export_comparison.py writes the retained evidence. Both runs use the same five FP32 shapes, the same seed and input bytes, and the same correctness checks; comparison.py, triton_target.py, experiment.py, and Cargo.lock are byte-identical between the two namespaces, and the evidence records a SHA-256 for each source file and for the built binary.
- Event spans: three rounds of 100 measurements per implementation and operation, 25 warmup calls per round, rotating implementation order. Every measured run passed a full-output comparison (
rtol=atol=1e-4), which is 45 operation/implementation/round checks. Means use all 300 samples; the plotted whiskers are the range of the three round means. - Kernel time: 15 Nsight Systems captures, one per operation and implementation, 100 iterations each. The plotted value is the sum of captured kernel durations divided by requested iterations, so a multi-kernel PyTorch operation is compared with the complete custom operation.
- Namespace: the new run writes
artifacts/mage-002-kernelsandartifacts/mage-002-kernels-nsys; the published evidence is comparison-results.json and comparison-profiles.json under themage-002result namespace.
After the build environment described in the guide, the comparison is reproduced with an explicit experiment namespace:
.venv/bin/python examples/oxide/comparison.py --output artifacts/mage-002-kernels
.venv/bin/python examples/oxide/profile_suite.py \
  --inputs artifacts/mage-002-kernels --output artifacts/mage-002-kernels-nsys \
  --languages python triton rust
.venv/bin/python examples/oxide/export_comparison.py \
  --events artifacts/mage-002-kernels --profiles artifacts/mage-002-kernels-nsys --experiment mage-002
uv run --script scripts/plot-comparison.py --experiment mage-002
uv run --script scripts/plot-kernel-improvements.py --experiment mage-002 --baseline mage-001
Both plotting scripts read the committed evidence, validate the sample counts and correctness flags, and write the desktop and mobile SVGs, the downloadable PNGs, and the accessible value tables. The pages need only the committed files.
Limits
- The library baselines are still ahead. The rewritten matrix multiply is 2.60 × PyTorch’s library call and 1.67 × Triton’s kernel at this shape, so the rewrite closes a gap without closing it. Layer normalization is 1.38 × Triton’s kernel and roughly level with PyTorch’s (11.1 µs against 11.4 µs).
- One workstation. These are five fixed shapes on one WSL RTX 4090 with unlocked clocks and no exclusive-use guarantee. The LayerNorm event span for the rewritten kernel spread from 13.5 µs to 19.0 µs across the three rounds, which is wider than the difference being discussed.
- One capture per case. Kernel time comes from a single Nsight Systems capture per implementation and operation, so it has no round-to-round interval of its own. Nsight Compute counters remain unavailable: occupancy, cache-hit rates, and memory throughput are unknown here, and no bottleneck is attributed.
- Two rejected variants. Both are single-run development measurements, not part of the retained captures or of the tables above. A
layer_norm_tilevariant that held a row of 128-bit quads in a[F32x4; 8]array measured 22.12 µs of kernel time against 11.02 µs for the retained warp kernel in the same build (its CUDA-event mean was 24.82 µs against 13.71 µs), so holding the row per thread cost roughly twice the time. An 8 × 4 register tile on 128-row blocks measured 147.74 µs around the call against 145.61 µs for the retained 4 × 4 tile with the 32-deep K step in the same session: within the few percent this harness cannot resolve, and therefore not a reason to prefer it. - No tuning, no adaptation. The tile shapes and the K step were chosen by reasoning about reuse and barriers, not by an autotuning sweep or a compiled baseline. Compiled PyTorch, graph replay, batched launches, lower precision, tile tails, backward passes, and end-to-end service behavior are untested here.
- Scope of the evidence. The retained captures describe the measured revision only; later changes to the Rust kernels are not part of these measurements.
Measurements and reproduction in GitHub · The first field note · Continuing research