Journal / 10 September 2026 / mage-004
Tiles the compiler chose
A tile compiler met the hand-written kernels on five FP32 operations. It won one, matched another and lost two — and the losses are exactly where data reuse is highest, which is where layout decides the answer.

The four spots are the four implementations, opacity set by how competitive each is.
Field: Paper Shaders mesh gradient (Apache-2.0), palette and weights from this post.The claim. Give a compiler the job of deciding how a GPU kernel places its data, and it will do well where reuse is low and worse where reuse is high. On five FP32 operations, the cuTile Rust tile kernels beat the hand-written kernels on bias + GELU — $8.19\ \mu s$ against $11.0$ — drew on layer normalization, and lost on matrix multiply, triangle contraction and neighbor aggregation by $1.6\times$, $1.4\times$ and $3.4\times$.
Two arguments carry that claim, and both are about memory rather than arithmetic.
Reuse is a layout problem
A thread that computes one output element of $C = A B$ reads one value of $A$ and one of $B$ per multiply-add. A thread that computes a $4\times4$ block reads four of each and performs sixteen multiply-adds, so shared-memory reads per multiply-add fall from $\tfrac{2}{1}$ to $\tfrac{8}{16} = 0.5$ — and loading those as 128-bit quads takes it to $0.125$: one instruction fetching all four values the thread needs.

The same product, two ways of placing it in memory: the compiler decides how the tile is threaded and how wide the loads are, the kernel author decides the register tile and the transposed $A$. Download the SVG.
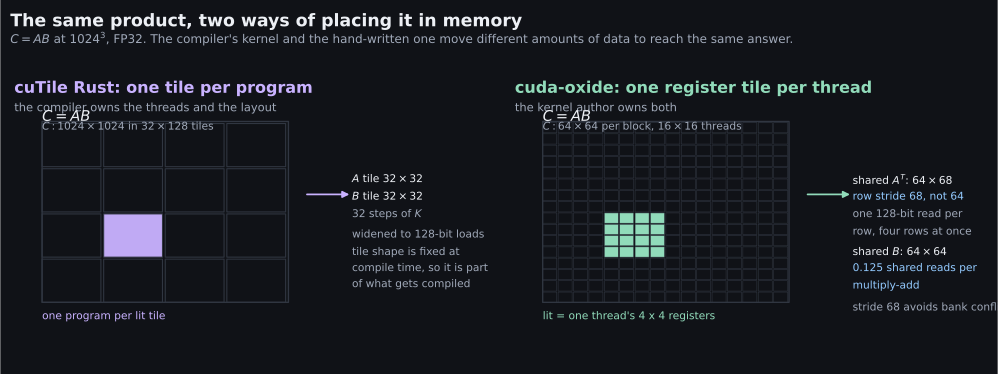
The tile compiler is not blind to any of this: it widens loads too, and it partitions the output into $32\times128$ tiles with $32\times32$ operands per contraction step. What it cannot know is that this problem wants a particular arrangement. Its matrix multiply is $1.6\times$ slower, and no arithmetic explains that — only where the operands sit when the multiply issues.
The clock measures two things
Time around a call is submission plus execution:
\[\text{span} \;=\; \underbrace{t_{\text{submit}}}_{\text{host builds and queues}} \;+\; \underbrace{t_{\text{kernel}}}_{\text{device runs}} \;+\; \text{idle}\]The tile runtime submits lazily, and one awaited call costs $14\text{–}23\ \mu s$ of host time against $2\text{–}3\ \mu s$ for the hand-written kernel. It is the difference between a taxi meter that starts when you pick up the phone and one that starts when the wheels turn: a comparison that waits for every call is comparing phone calls, not journeys. Bias + GELU measures $29.97\ \mu s$ around a kernel that runs in $8.19\ \mu s$. Queue the calls, or replay them from a recorded CUDA graph, and every operation lands on its kernel time:
| Operation | awaited | queued in tens | kernel only |
|---|---|---|---|
| Matrix multiplication $1024^3$ | 150.53 | 127.07 | 131.56 |
| Bias + GELU $4096\times768$ | 25.76 | 8.50 | 8.19 |
| LayerNorm $4096\times768$ | 30.62 | 10.64 | 10.76 |
| Triangle contraction $128\times32$ | 136.19 | 121.80 | 116.08 |
| Neighbor aggregation $4096\times64\times65536$ | 49.28 | 33.28 | 35.37 |
Microseconds, mean of 100 launches. Replay reaches $7.77\ \mu s$ on bias + GELU. Timed the same way, Triton and PyTorch also improve, by $6\text{–}7\ \mu s$ and about $1\ \mu s$ per call.
Evidence
Kernel time from separate Nsight Systems captures, 100 launches each. Every output was checked against PyTorch with TF32 disabled before any timing was believed.
| Operation | PyTorch | Triton | cuTile Rust | cuda-oxide Rust |
|---|---|---|---|---|
| Matrix multiplication $1024^3$ | 56.04 | 83.06 | 131.56 | 80.00 |
| Bias + GELU $4096\times768$ | 15.88 | 7.73 | 8.19 | 11.0 |
| LayerNorm $4096\times768$ | 11.42 | 8.15 | 10.76 | 10.05 |
| Triangle contraction $128\times32$ | 28.64 | 102.19 | 116.08 | 80.1 |
| Neighbor aggregation $4096\times64\times65536$ | 67.32 | 7.97 | 35.37 | 10.3 |
Microseconds of GPU kernel time per operation. Layer normalization is worth reading twice: the tile kernel pads every $768$-wide row out to $1024$, because tile dimensions must be powers of two, so a third of its lanes do nothing — and it still draws.
Tile shape turned out to be the same kind of decision: the identical kernel measured $738\ \mu s$ at the tutorial’s $16\times16\times8$ tile and $131.56\ \mu s$ at $32\times128\times32$, and $128\times128\times8$ was $2.3\times$ slower than a smaller tile. That non-monotonicity is a register or occupancy cliff, not arithmetic.
What was tried and not kept
- A broadcast product instead of the matrix instruction. It did not compile, and the matrix instruction kept FP32 accuracy anyway: $1.5\times10^{-5}$ against the strict reference at $K = 1024$ — accumulation error, not a 10-bit mantissa’s.
- Deeper contraction steps at small tiles. $16\times16\times32$ measured $1072\ \mu s$ against $738$ at $16\times16\times8$.
- A loop over the channel axis in the triangle kernel. Every channel read the first channel’s values; a partition load indexed by a loop variable does not vary, so the channel has to come from the grid axes.
- One row per program for layer norm. It runs, but it forces the $768 \to 1024$ padding.
What these numbers do not establish
No hardware counters are available on this host, so occupancy and bandwidth are inferred from ratios rather than read. The cuda-oxide column is a previous round’s measurement, not taken in the same session, so the two Rust columns should not be subtracted from each other. One capture per operation means a kernel time carries no interval of its own, and compilation, transfers and process startup are excluded throughout.
The field note has the full tables, and the technical record has the method, the compiler’s constraints and the reproduction commands.