Field note 004 / Mathematics on a GPU
What the compiler chose
A tile compiler makes the memory decisions for you. On five FP32 operations it wins one, draws one and loses three — and the losses are exactly where data reuse is highest, which is where layout decides the answer.

The claim. Give a compiler the job of deciding how a GPU kernel places its data, and it will do a good job where the reuse is low and a worse one where the reuse is high. On five FP32 operations, the cuTile Rust tile kernels beat the hand-written ones on bias + GELU ($8.19\ \mu s$ against $11.0$), draw on layer normalization ($10.76$ against $10.05$), and lose on matrix multiply ($131.56$ against $80.00$), triangle contraction ($116.08$ against $80.1$) and neighbor aggregation ($35.37$ against $10.3$).
Two things support that claim, and both are about memory rather than arithmetic.
The first argument: reuse is a layout problem
Matrix multiplication is the clearest case, because the arithmetic is free: every implementation computes $C = A B$ with the same multiply-adds, and the only question is how often each value has to be fetched. A thread that computes one output element reads one value of $A$ and one of $B$ per multiply-add. A thread that computes a $4 \times 4$ block of outputs reads four of $A$ and four of $B$ and performs sixteen multiply-adds, so shared-memory reads per multiply-add fall from $\frac{2}{1}$ to $\frac{8}{16} = 0.5$, and reading those values as 128-bit quads takes it to $0.125$ — one instruction fetching the four values a thread needs.

$C = A B$ at $1024^3$ in FP32. On the left the compiler decides how the tile is threaded and how the loads are widened; on the right the kernel author does. The transposed $A$ with a row stride of 68 exists so that each thread's four rows are contiguous — one 128-bit read instead of four scattered 32-bit ones.
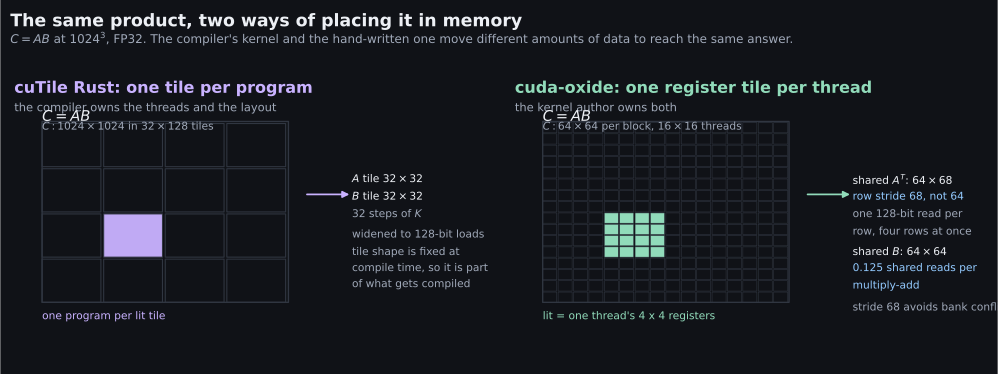
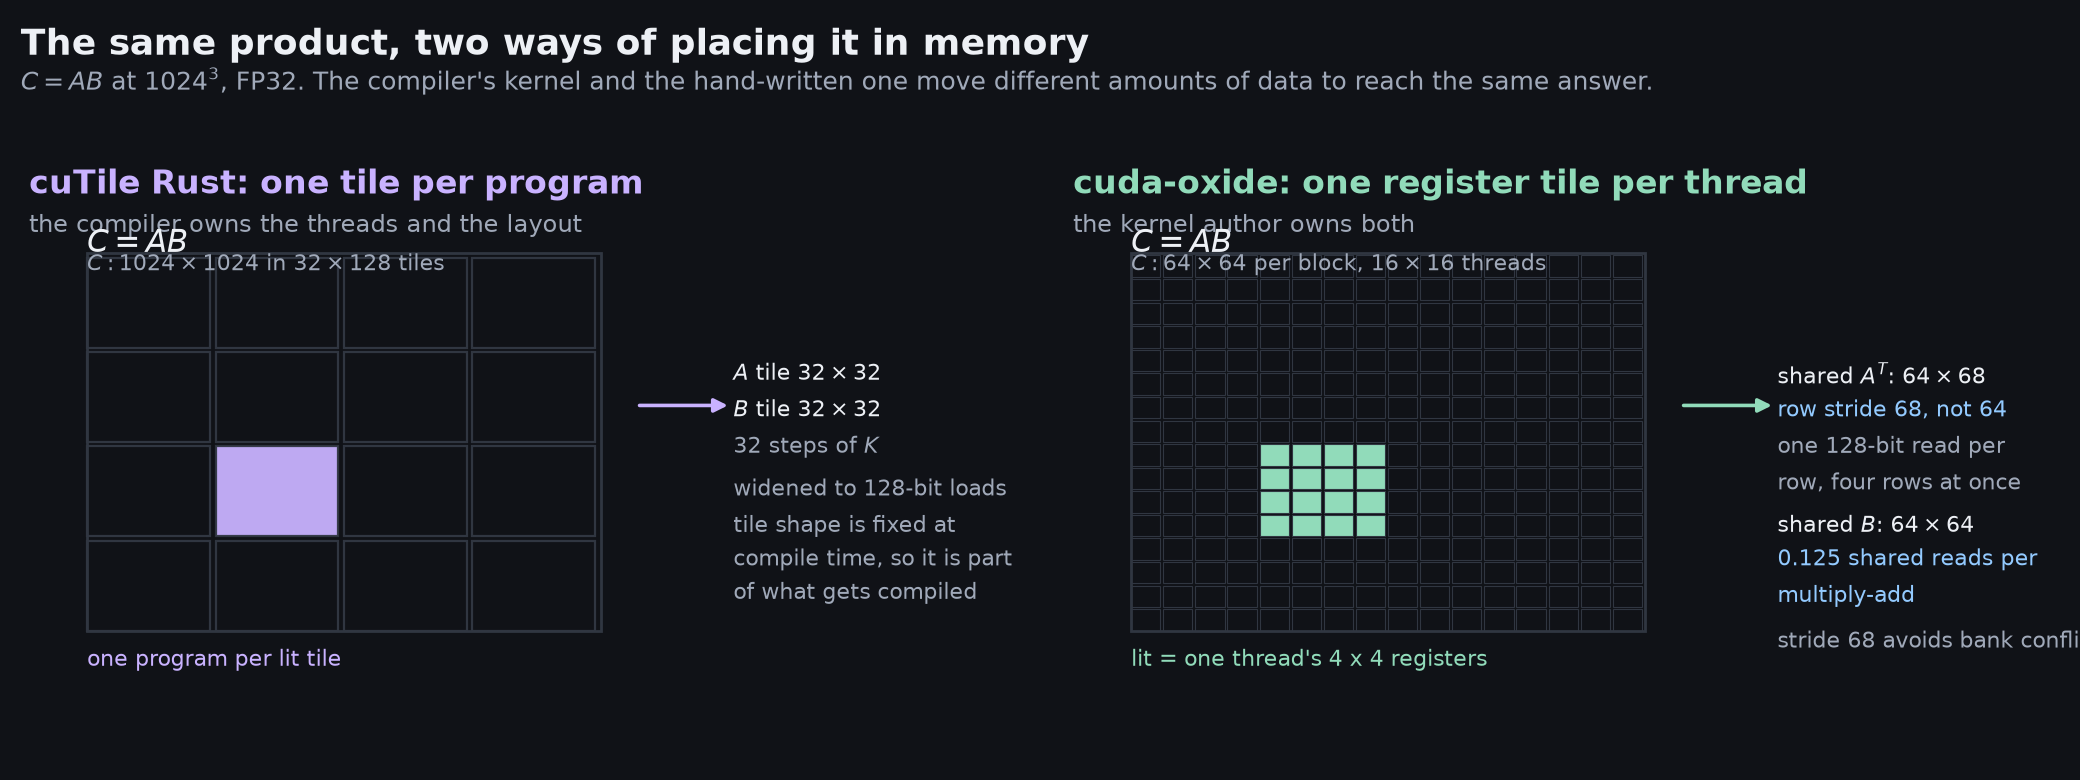
The tile compiler is not blind to this. It widens loads too, and it partitions the output into $32 \times 128$ tiles with $32 \times 32$ operands per contraction step. What it cannot know is that this particular problem wants a different arrangement: the shapes that win are the ones whose default layout happens to be close to good, and matrix multiply is not one of them. Its kernel is $1.6\times$ slower, and nothing about the arithmetic explains that — only where the operands sit when the multiply instruction issues.
The second argument: the clock measures two things
Time around a call is not the kernel’s time. It is submission plus the kernel:
\[\text{span} \;=\; \underbrace{t_{\text{submit}}}_{\text{host builds and queues}} \;+\; \underbrace{t_{\text{kernel}}}_{\text{device executes}} \;+\; \text{idle}\]The tile runtime submits lazily, and one awaited call costs $14\text{–}23\ \mu s$ of host time against $2\text{–}3\ \mu s$ for the hand-written kernel. So a comparison that waits for every call is comparing submission paths, and the tile kernels look far worse than they are: bias + GELU measures $29.97\ \mu s$ around a kernel that runs in $8.19\ \mu s$.
| Operation | awaited | queued in tens | kernel only |
|---|---|---|---|
| Matrix multiply $1024^3$ | 150.53 | 127.07 | 131.56 |
| Bias + GELU $4096\times768$ | 25.76 | 8.50 | 8.19 |
| LayerNorm $4096\times768$ | 30.62 | 10.64 | 10.76 |
| Triangle contraction $128\times32$ | 136.19 | 121.80 | 116.08 |
| Neighbor aggregation $4096\times64\times65536$ | 49.28 | 33.28 | 35.37 |
Microseconds, mean of 100 launches. Queued, every row lands on its kernel time; replaying ten launches from a recorded CUDA graph does the same ($7.77\ \mu s$ for bias + GELU).
Evidence
Kernel time, one Nsight Systems capture of 100 launches per implementation. Every output was checked against PyTorch with TF32 disabled before any timing was believed; the worst error is $1.5\times10^{-5}$ on the matrix multiply.
| Operation | PyTorch | Triton | cuTile Rust | cuda-oxide Rust |
|---|---|---|---|---|
| Matrix multiplication $1024^3$ | 56.04 | 83.06 | 131.56 | 80.00 |
| Bias + GELU $4096\times768$ | 15.88 | 7.73 | 8.19 | 11.0 |
| LayerNorm $4096\times768$ | 11.42 | 8.15 | 10.76 | 10.05 |
| Triangle contraction $128\times32$ | 28.64 | 102.19 | 116.08 | 80.1 |
| Neighbor aggregation $4096\times64\times65536$ | 67.32 | 7.97 | 35.37 | 10.3 |
Microseconds of GPU kernel time per operation, summed over however many kernels each operation launches. Lower is better.
Layer normalization is worth reading twice. The tile kernel pads a $768$-wide row to $1024$ — tile dimensions must be powers of two — so a third of its lanes do nothing, and it still draws with the hand-written kernel. Out of padding, it would win.
Tile shape is part of the layout
The same kernel and the same arithmetic, twelve tile shapes: $738\ \mu s$ at the tutorial’s $16\times16\times8$, $201\ \mu s$ at $128\times64\times8$, and $469\ \mu s$ at $128\times128\times8$ — $2.3\times$ slower than a smaller tile, which is a register or occupancy cliff rather than arithmetic. The library’s autotuner then searched the space properly: 36 candidates, each validated before timing, and its pick measured $137.28\ \mu s$ against the hand-picked tile’s $189.44\ \mu s$. Every number in the table above was re-measured with it.
What the compiler would not let us write
- Tile dimensions must be powers of two. A $768$-wide row is rejected with
failed to compile Tile IR programand no further detail. - A partition load indexed by a loop variable does not vary. The triangle kernel read the first channel every time until the channel came from the grid axes.
- A
Tile<..>inside an expression is not rewritten by the entry macro; it belongs in aletannotation. convert_scalarhas nou32→i32, so the CSR arrays are uploaded asi32.- Scalar comparison is not a supported operator, so the edge walk counts its edges.
The irregular operation needed raw device pointers (load_ptr_tko) to read its row pointers and
edge indices. That escape hatch is the honest boundary of the safe tile model, and it is why that
kernel trails furthest.
What the numbers do not establish
- No hardware counters are available here, so occupancy and bandwidth are inferred from ratios.
- One capture per operation: a kernel time carries no interval of its own.
- The cuda-oxide column is the third note’s retained measurement, not taken in the same session.
- Timings are sensitive to a busy device: a repeat that shared the GPU with another capture showed three to twenty times larger spans for the same binary.
Reproduce
source scripts/cutile-env.sh
cd examples/cutile && cargo build --release && cd ../..
.venv/bin/python examples/oxide/comparison.py --implementation cutile \
  --experiment mage-004 --output artifacts/mage-004-comparison \
  --rounds 3 --iterations 100 --warmup 25
CUTILE_MATMUL_TILE=BM,BN,BK picks a tile shape, --mode single|batch|graph the launch path, and
--features tune adds the autotuner. Run one device experiment at a time.