Field note 005 / Mathematics on a GPU
What the loop found, and what answered it
A benchmark that generates its own kernel variants, the interaction it found between staging structure and K step, the measurement discipline that stopped two claims from surviving as stated, and the hand-written pipeline that then went further.
The third field note ended with the two Rust kernels at 80.0 µs and 10.05 µs of GPU kernel time, and with a list of levers nobody had tried. This note is about the part that came next: instead of choosing the next change by hand, the benchmark was given the ability to propose changes, measure them, and keep or reject them on its own. It took twelve generations to find something. That something was not a knob — and it was not the last word either: a hand-written pipeline that landed afterwards went 11% further, which is the more interesting half of the story.

The question
Can the measurement harness close its own loop? Concretely: can it generate a kernel from parameters, build it, check it against the reference, measure it against both the configuration it has and the committed kernel, decide, and remember — without a person choosing what to try next?
The value is not that a search runs. It is that a search which records why each step was taken and what was rejected makes two things possible later: a proposer that can learn which kinds of change pay, and a reader who can audit the path. Everything here is arranged around those two.
The loop
Five operations’ worth of kernels live in examples/oxide/src/main.rs. The loop never touches them. It renders a separate generated module from two templates in two roles — best, the configuration it holds, and new, the proposal — so one build contains both and both are measured under identical conditions in the same round. A manifest field selects which one runs; a manifest without it runs the committed kernels, which is how every earlier field note stays reproducible.
| Knob | Values | Meaning |
|---|---|---|
transpose_a |
true / false | $A$ staged k-major so a thread’s four rows are one 128-bit read, or row-major |
quad_stage |
true / false | staging loads as 128-bit quads, or four scalars |
staging |
shared / exact / guarded |
one loop sharing a quad decomposition, guard-free loops, or one branch per tile |
k_step |
16, 32, 64, 128 | depth of the contraction step |
block, thread_tile |
pairs | block tile and per-thread register tile |
warps_per_row, threads |
1, 2, 4, 8 / 128, 256, 512 | layer normalization split |
A proposal is validated against the geometry it implies before anything is compiled: the 48 KB static shared-memory budget, whole-warp thread counts, four-element alignment, and the preconditions of each staging form. k_step 128 at the default tile is refused this way (67 584 B), which costs a function call rather than a build.
Each generation is one build, three rounds of three paired runs (candidate, incumbent, committed kernel) in a rotating order, and one ledger entry. A generation is kept only if the full output matches the PyTorch FP32 reference, the committed control stayed within 3%, and the median of the paired per-round ratios clears 1%.
The first run
Started from the arrangement the first field note measured — row-major $A$, scalar staging, a 64-deep contraction step — the loop took three of twelve generations. Event spans, worst-of-round medians, 1024³ FP32:
| Gen | Change | Before | After | Ratio | Decision |
|---|---|---|---|---|---|
| 1 | transpose_a false -> true |
119.81 µs | 93.18 µs | 0.778 | keep |
| 2 | quad_stage false -> true |
93.18 µs | 84.99 µs | 0.912 | keep |
| 4 | k_step 64 -> 32 |
84.99 µs | 78.59 µs | 0.924 | keep |
| 3, 5-7 | the same knobs reversed, k_step 16 |
— | 81.9-108.3 µs | 1.04-1.31 | reject |
| 9-12 | 128 × 64 and 64 × 128 tiles, other staging forms | — | 83.8-84.7 µs | 1.07-1.08 | reject |
The first two steps are the ones the third field note chose by hand, which is the sanity check the loop had to pass: it rediscovered them from measurements alone, in the same order, with the same reasons. The third step is where it disagreed with the record — k_step 32 was not an improvement in the earlier captures, which had measured 32 -> 64 as a gain.
The win was a combination
The loop measures the CUDA event span around the call. The field notes measure GPU kernel time from Nsight Systems captures, so the retained configuration was re-measured with that instrument (scripts/evolve_capture.py, capture_range="cuda", the binary’s own capture bracket, 100 iterations per arm, arms interleaved). The committed kernel reproduced its published value — 79.8-81.0 µs against the recorded 80.00 — which is what makes the comparison usable at all.
| staging structure | k_step |
kernel µs | vs committed |
|---|---|---|---|
shared (the committed kernel then) |
64 | 80.31 | 1.000 |
exact (guard-free, one loop) |
64 | 80.29 | 0.999 |
exact |
32 | 82.43 | 1.028 |
guarded (one branch per tile) |
64 | 82.97 | 1.034 |
guarded |
32 | 76.29 | 0.951 |
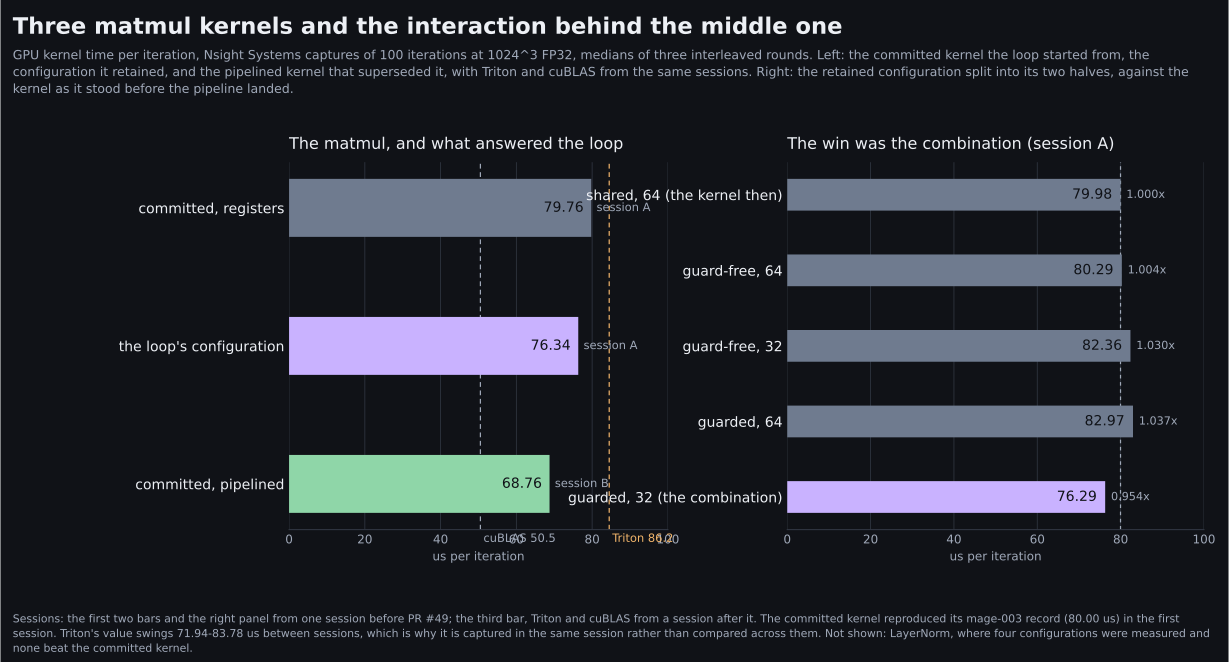
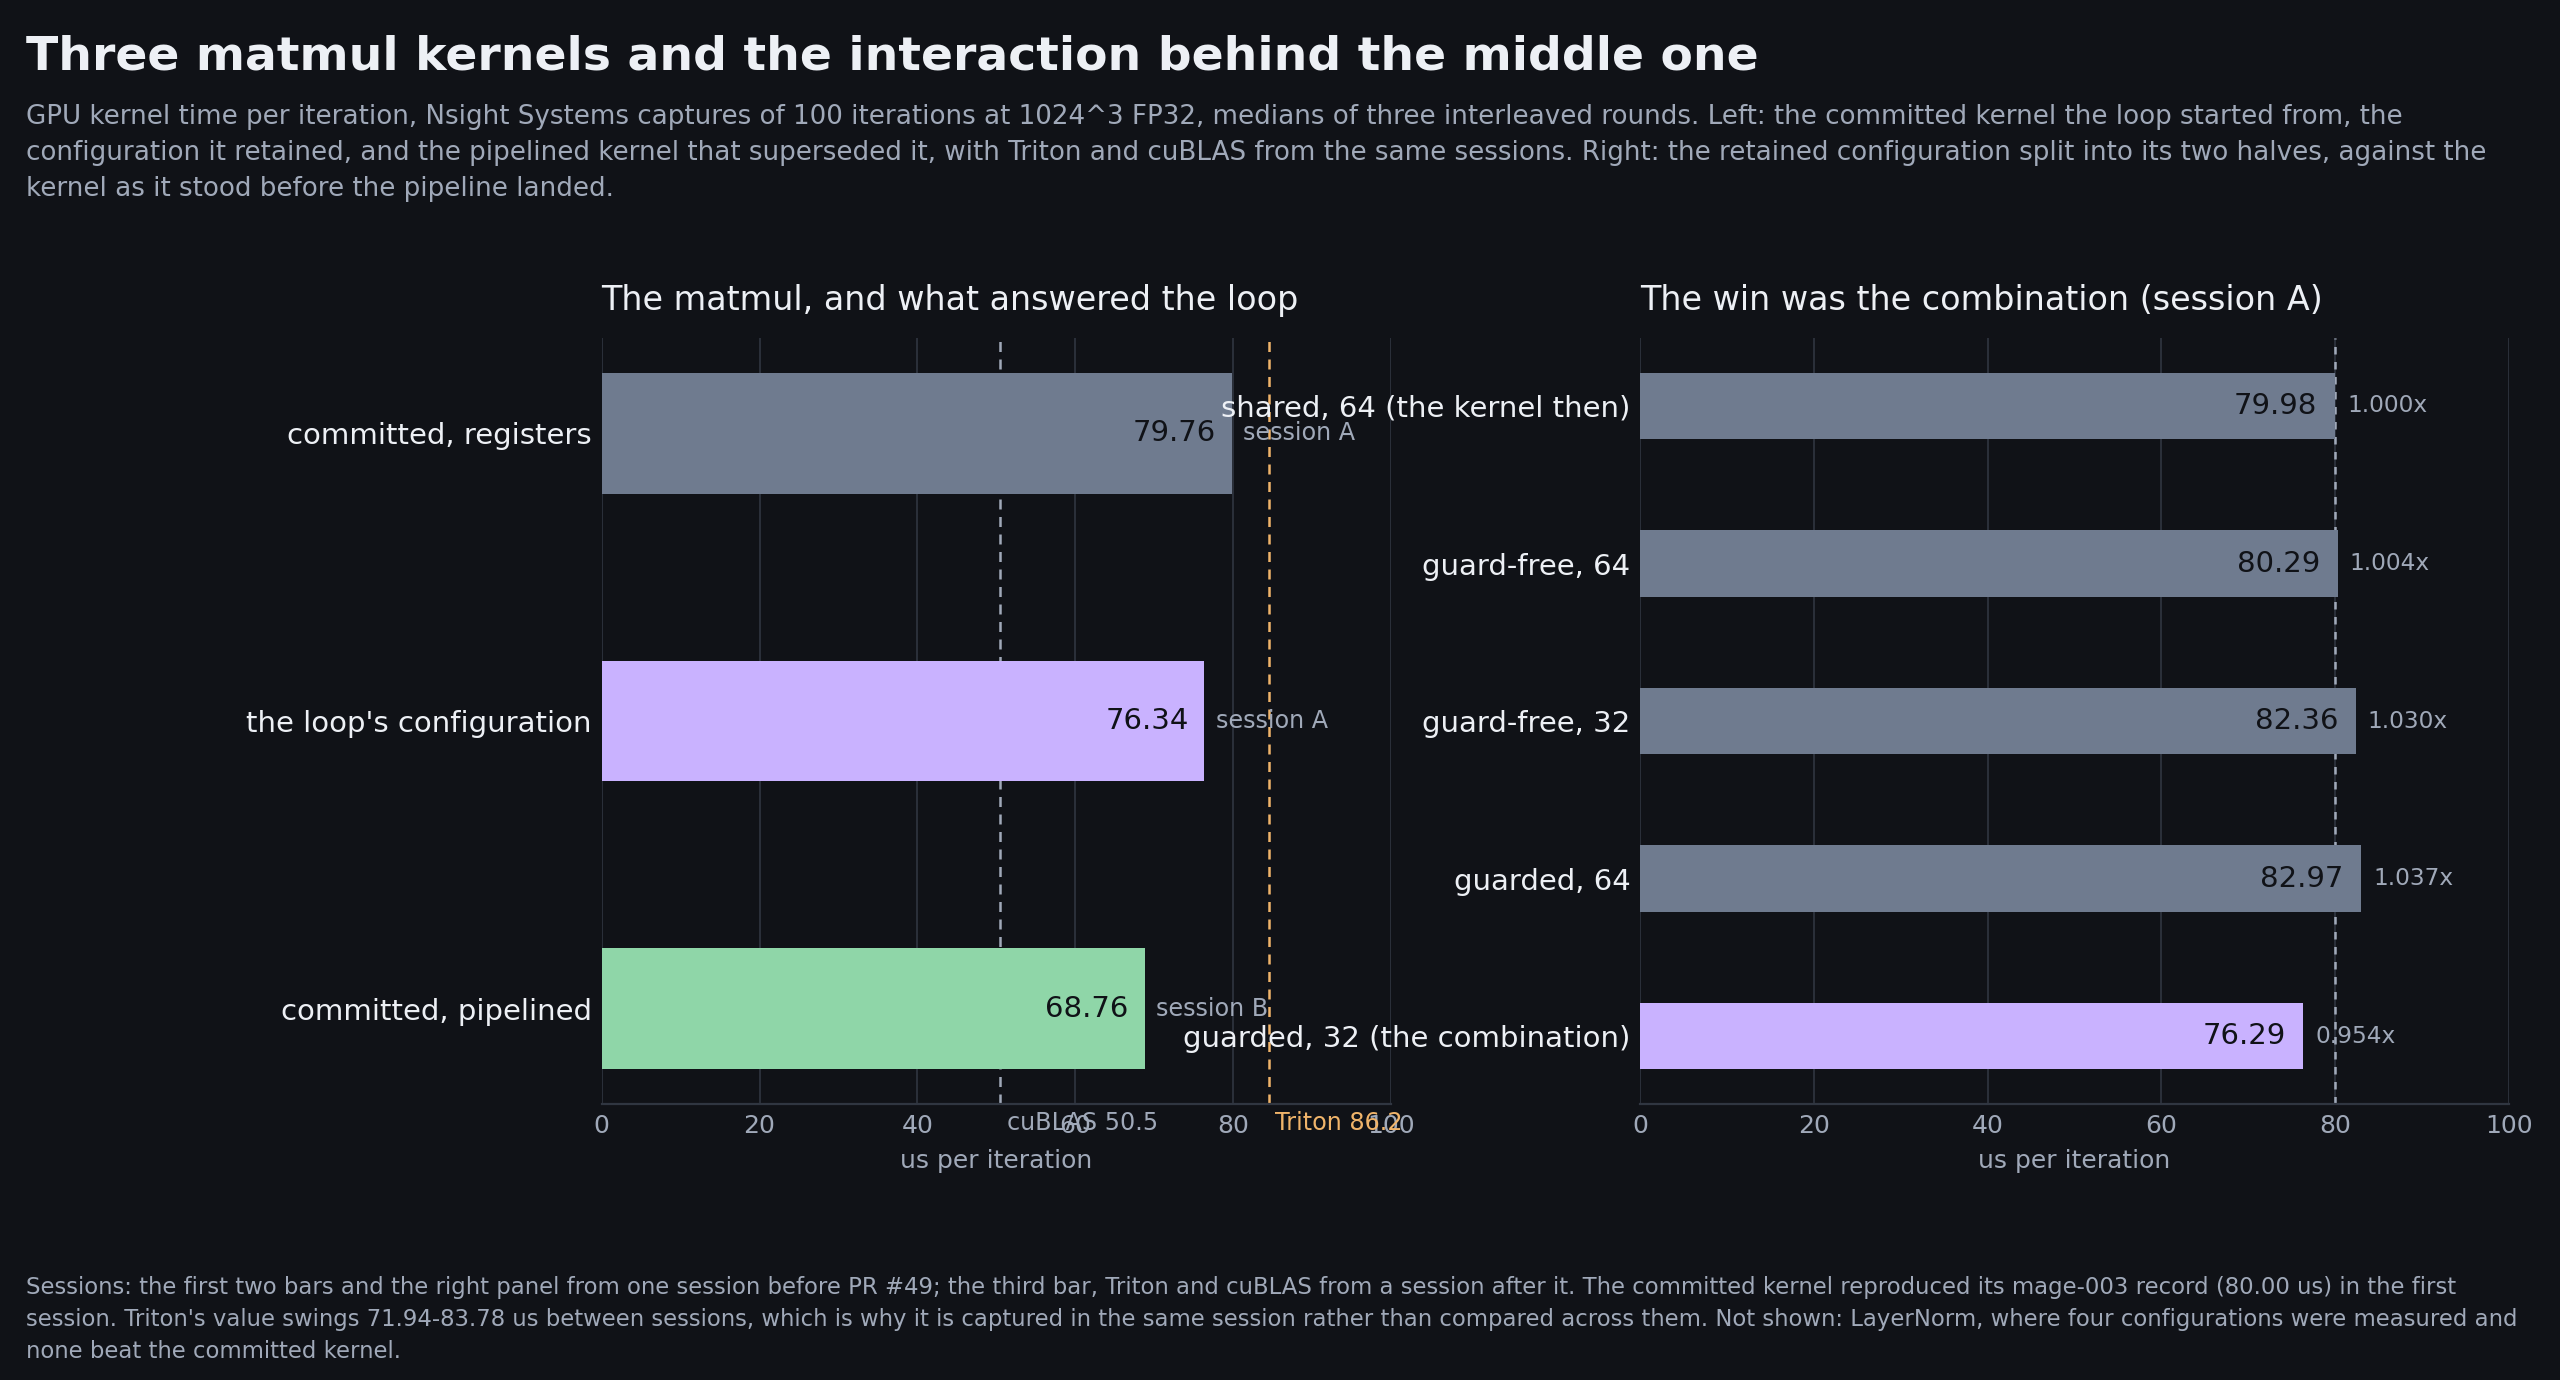
Each row is one paired session. The k_step change the loop kept is slower in the guard-free structure, and the guarded structure is slower at k_step 64. Neither knob alone explains the retained configuration; the combination was 4.9% faster than the kernel of that session.
What answered it
A double-buffered cp.async kernel then landed in the committed set (tiled_matmul_pipeline, PR #49) and the host selects it for this shape. Captured in one session, three interleaved rounds of 100 iterations:
| Implementation | Rounds (µs/iter) | Median |
|---|---|---|
Rust, committed (tiled_matmul_pipeline) |
69.02, 68.76, 68.44 | 68.76 |
| Rust, the loop’s configuration | 77.09, 76.25, 76.09 | 76.25 |
Triton (matrix_kernel) |
79.32, 86.22, 86.50 | 86.22 |
PyTorch -> cuBLAS (cutlass simt sgemm 128x64) |
49.26, 50.50, 56.03 | 50.50 |
The pipeline is 11% faster than the configuration the loop retained, and 13.8% faster than the kernel it replaced (79.76 µs in the earlier session). On this shape the loop’s kernel is superseded, and that is the honest reading of its contribution: what it produced was a diagnosis — two structures that issue the same copies in different orders differ by 8%, which points at the staging latency rather than at arithmetic or reuse — and overlapping those copies is what the hand-written pipeline does. The generated templates have no cp.async form, so the loop cannot yet be asked to tune inside the pipelined structure.
The comparison across sessions is fair only because the arms are stable: the loop’s configuration measured 76.34 µs in the earlier session and 76.25 µs in the later one, and the committed arm reproduced its published value in the session where it was still the registers kernel. cuBLAS remains 1.36× ahead of the best Rust kernel, and its own spread across three rounds (49.3-56.0) is as wide as some of the gaps discussed here, so it is quoted with that caveat.
The loop can search inside it now
The generated templates gained the pipelined form as a staging value, so the loop can be
asked to tune inside the structure rather than only around it. Rendered at the hand-written
parameters it reproduces that kernel: 67.69 against 68.44 µs of kernel time (0.989), and
+0.38% over eight paired rounds of event span. Eight generations started from that
configuration were all refused. The width of the A copies and quad_stage move the
pipelined kernel by 0.1-0.3% — the same two knobs were worth 1.6x in the synchronous form,
so once the copies overlap the constraint has moved and the measurement reads as noise.
k_step 32 is confirmed, larger tiles are worse, and the synchronous forms are 20% behind.
The hand-written design decisions are what an independent search finds too. The space around the pipeline is flat, which is the honest close of this thread: the next gain will not come from re-arranging it.
What the measurement cost to learn
Two claims were made during this work and then withdrawn. Both are worth recording, because both would have survived into a published number.
A cold confirmation overstates a gain. The confirmation step first read +4.36% and then +4.94% for a pair that measures +2.47%. On this machine the committed kernel reads 77.82 µs on the first measurement after an idle period and 82.94 µs once its clocks settle — a 6% swing in one direction. The confirmation now burns in four unrecorded pairs, prepares two input directories per arm so no round pays a cold-cache cost, runs eight recorded rounds with the arm order alternating, and quotes the median rather than the mean.
A single boosted round is not evidence. The accept rule originally compared the fastest round on each arm. With clock-boost excursions of about 10% landing on either arm — the candidate read 72.70 µs once and the committed kernel 77.82 µs once in the same session — that rule could be carried by one boosted round: a candidate with 80, 100, 100 against an incumbent of 100, 100, 100 was accepted at 0.80. The rule now judges the median of the paired per-round ratios.
A third finding is recorded rather than explained: the first kernel-time capture ran about sixty times slower than every later one (846 s against 14 s for the same work) and read no gain at all, while the committed arm read normally. Four later sessions and two structural sessions disagreed with it. It stays in the evidence directory.
LayerNorm: a null result
The same loop on layer normalization ran four generations and kept none. One warp per row measured 13.07 µs against 12.29; four warps per row and 128-thread blocks both measured 12.29 against 12.29; 512-thread blocks measured 13.31. One generation was refused outright because the committed control drifted 12.5% inside it.
The committed arrangement — two warps per row in a 256-thread block — is a local optimum in that space, and the loop reports that instead of manufacturing a change.
That prediction was then tested outside the loop. A block-per-row kernel (layer_norm_row, PR #52) gives each thread a quad plus a masked tail quad, reduces four warps with shuffles behind one barrier, and uses the approximate reciprocal square root. Captured in one session, three interleaved rounds of 100 iterations, kernel microseconds per iteration:
| Implementation | Rounds | Median |
|---|---|---|
Rust, committed (layer_norm_row) |
8.770, 8.842, 8.931 | 8.842 |
| Rust, the loop’s configuration (two warps per row) | 10.133, 10.345, 10.413 | 10.345 |
Triton (norm_kernel) |
8.002, 8.288, 8.231 | 8.231 |
PyTorch (vectorized_layer_norm_kernel) |
19.532, 11.217, 11.922 | 11.922 |
The committed kernel is 7% behind Triton where the generated form is 26% behind. The remaining distance needed a different decomposition rather than a different split of the same work — which is what the loop’s null result implied, and what its templates cannot express. That is now the second such gap: cp.async for the matrix multiply, block-per-row for the normalization. Both were closed by hand.
The layer normalization work did surface a real defect. layer_norm_pair splits a row between two warps in whole 32-lane steps, which double-counts part of the row whenever each warp’s span is not a multiple of 32. Width 768 (span 96) hid it; width 128 failed the reference at 0.43 absolute error. The host now keeps that kernel to widths it can share and otherwise takes the single-warp kernel, whose every access is guarded.
What this does not establish
- One shape (1024³), one dtype (FP32), one GPU (RTX 4090, unlocked clocks, WSL). Nothing here speaks to training shapes, batching, or a different device.
- No hardware counters are available, so the interaction is attributed by paired captures, not explained by a bounded resource. The guard branches are the only structural difference between the two forms that bracket the retained kernel at the same
k_step, and why they help is still open — the pipeline’s win suggests the answer is where the copies wait, not how many there are. - The loop optimizes what it measures. Every accepted step improved the event span; only the retained configuration also improved kernel time, and the loop could not tell the difference at the time.
- It never proposed anything structural — no
cp.async, no split-K, no block-per-row normalization — because its templates cannot express them. Both improvements that followed the loop’s own came from that unsearchable space, which is where the next work goes. - The retained configuration is not the fastest kernel in the repository any more, and it is not claimed to be.
Method and evidence
- Loop, renderer, policy and the space audit:
scripts/evolve_render.py,scripts/evolve.py,scripts/evolve_policy.py,scripts/evolve_audit.py. The audit renders, builds, runs and reference-checks every reachable configuration (40 for matmul, 11 for layer normalization); it reports 0 failures. - Regression contracts:
tests/test_evolution.py(16 cases: parameter constraints, render determinism, generated array sizing, accept rule, proposer rules, one GPU case). - Kernel-time captures, one file per paired session:
docs/assets/results/evolution-loop/kernel-time/. Nine captures, including the anomalous session. - Loop runs and ledgers:
docs/assets/results/evolution-loop/. - Figure:
scripts/plot-evolution-kernel-time.py, values read back from those captures, with a layout check.