Journal / 11 September 2026
The 4090 and the Nano
The same 13 CUDA launches cost 4.78 ms on the RTX 4090 and 39.18 ms on the Orin NX — 8.19×, with residency ruled out as the cause — and the first deploy of the stack to the board found a hang, not a mission.
The claim. The verification story so far is kernel-level, on both machines, and the gap between
them is measured. The same 13 CUDA launches over 5 kernels cost 4.78 ms of kernel time on the
RTX 4090 (docs/evidence/baseline-2026-09-11/, commit 76143f0) and 39.18 ms on the Orin NX
(docs/evidence/T50/pinkie-kernels/, a28736f) — 8.19× slower. Two kernels are 99.6 % of it:
belief_update 12.976 ms and cognition_update 12.991 + 13.046 ms, both one block of 1024
threads where each thread walks a full 1024-wide row in a serial loop. The counters separate two
questions: how many warps are resident on the SM at once (occupancy), and how much work each resident
warp issues per cycle (throughput). belief_update has 65.59 % of peak sustained-active warps —
almost the same as costmap_stats’ 64.58 % — but issues work at 1.52 % of peak SM throughput
against costmap_stats’ 16.58 %. An 11× difference in issued work per cycle at equal
residency is a loop problem, not an occupancy problem. And the deploy side has its own first result: the stack went
to the board at 25f2b6f7 and the probe hung — a plain-HTTP Leash on :8000 and a stack whose only
default address was https://127.0.0.1:8080, llama.cpp’s plain-HTTP port.
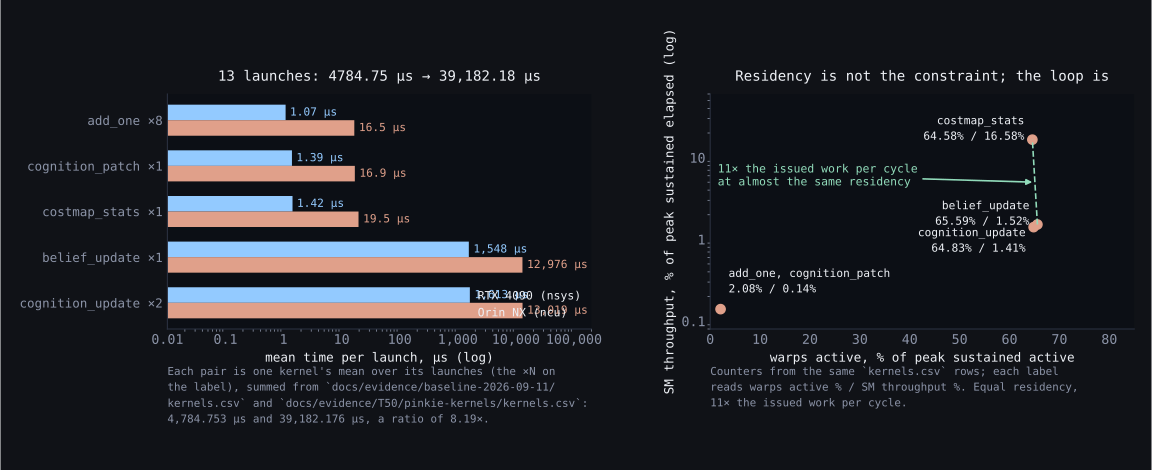
The same 13 launches on two machines: left, each kernel's mean time per launch on the RTX 4090
and the Orin NX (log axis), with its launch count, summing to 4,784.753 µs and 39,182.176 µs
(8.19×); right, the board's residency against its issued work per cycle —
belief_update and costmap_stats at 65.59 % and 64.58 % of peak
sustained-active warps but 1.52 % and 16.58 % of peak SM throughput.
What we tried
The mission tickets’ runs are not what this entry measures. Step 28 (an end-to-end mission on the
4090) is T28 (#44) and
Step 29 (the same on the Orin Nano) is T29 (#45).
When this entry landed on 2026-09-11T19:24Z, T28 had no comments at all and T29’s only comment was a
blocked deploy smoke, not a mission; no mission had run on either machine. T28 has since run its host
mission — open_missions 0 → 1 → 0, a sealed 2395-byte MCAP and the mission id in the session list,
on a zero-motion stack (docs/evidence/T28/4090-mission/ on ticket/T28, 449eeea). As of
2026-09-11T20:45Z, PR #213 was open with #44 status:review, T29’s board half had not run (#45
status:review, PR #211), and neither ticket was status:done. What this entry’s numbers measure is
the kernel suite, on both machines.
The board deploy was attempted early, on purpose, and recorded as blocked. Deploying 25f2b6f7
to ~/qualia-deploy/ and building natively on the board was cheap and proved the deploy path; the
run path then exposed, in order, that the toolchain is not on PATH for non-interactive SSH, that
cargo resolves every workspace member even for one -p (so one uncached dev-dependency of an
unrelated crate kills a single-package build), that the board’s registry cache is both partial and
older than main’s lock, and that the board has no DNS, so git clone and crates.io are both
unreachable and the only path is stage-and-ship. The recipe that works — git archive, scp, a
trimmed members list, cargo generate-lockfile --offline — is written into the comment and into
D-016/D-018.
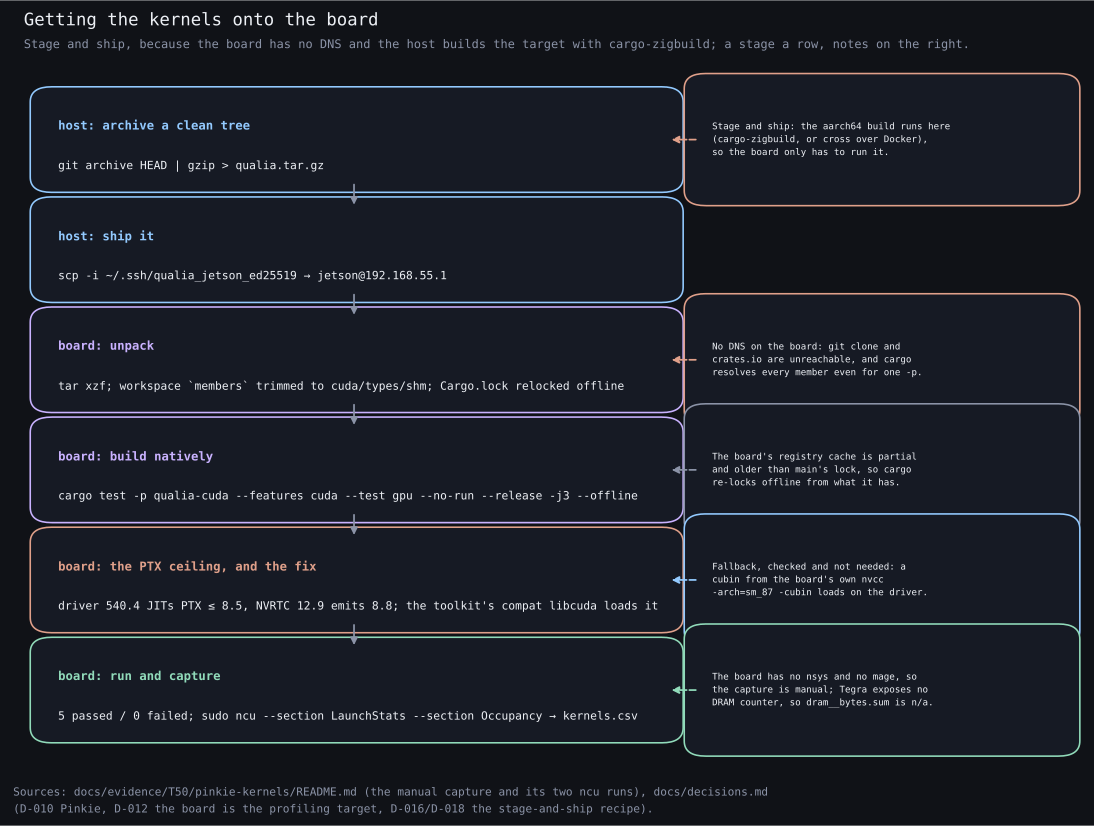
The stage-and-ship path: git archive on the host → scp to
jetson@192.168.55.1 → unpack with the workspace trimmed → native
--release --offline build → the PTX ceiling (driver 540.4 JITs ≤ 8.5, NVRTC 12.9
emits 8.8) and the compat-loader fix → 5 passed and the two ncu runs, each obstacle
as a note beside the stage it stopped.
Two obstacles were specific to the board’s driver. NVRTC 12.9 emits PTX ISA 8.8; the board’s
driver 540.4 JITs 8.5 and below, so every device test skipped itself with
CUDA_ERROR_UNSUPPORTED_PTX_VERSION. A direct driver probe found the ceiling (load ptx-8.5 result=0
/ ptx-8.6 result=222) and the fix: the toolkit’s forward-compatibility libcuda, reached with
LD_LIBRARY_PATH=/usr/local/cuda-12.9/compat. A cubin built by the board’s own nvcc -arch=sm_87
-cubin also loads on the stock driver and is the named fallback; the compat loader was used because
it changes neither the kernels nor the driver. Also stated, not hidden: the Tegra driver exposes no
DRAM counter, so dram__bytes.sum is n/a and no memory-bound verdict is claimed.
The same launches, two machines
The ranking reproduces; the durations do not. On the 4090 the same file cost 4784.75 µs with the same
13 launches and shapes. On the board it cost 39,182.18 µs with the GPC clock held near 306 MHz,
which is the board’s 10 W power mode, not a profiler artefact: the unlocked repeat reports the
same total to 0.001 % (39 182 176 vs 39 181 760 ns) and belief_update to 0.14 %. The board has
4 SMs in 2 TPCs, and the 1 × 1024 kernels launch one block in total — waves_per_sm 0.25 is that
one block averaged over four SMs, and register pressure caps it at one block per SM (theoretical
occupancy 66.67 %: 1024 of the 1536 threads the SM can hold). The 4090’s cycle count for the same
kernel is an inference, not a measurement — the capture did not measure that clock — but the shape
is what a latency-bound kernel predicts: the same cycles, a slower clock, a proportionally larger wall
time, and the naive shape is worst exactly where it ships.
The extruded mark plus one pillar per kernel in the board's capture, each pillar's height its mean time on the Orin NX — two pillars and three stubs, the 99.6 % the entry states — with a 60-frame rotation baked as an animation. If the viewer script does not load, the same GLB downloads from the same figure.
Evidence
| Quantity | Value | Unit | Source |
|---|---|---|---|
| 4090 kernel suite (baseline) | 4784.75 | µs | baseline-2026-09-11/README.md ^1 |
| Orin NX kernel suite | 39,182,176 (39.18 ms) | ns | T50/pinkie-kernels/README.md ^2 |
| Board / 4090 ratio | 8.19× | — | same ^2 |
belief_update on board |
12,976,128 | ns | same ^2 |
cognition_update on board |
13,046,368 / 12,991,136 | ns | same ^2 |
Warps active, belief_update |
65.59 | % of peak | same ^2 |
SM throughput, belief_update |
1.52 | % of peak | same ^2 |
SM throughput, costmap_stats |
16.58 | % of peak | same ^2 |
| Launches / kernels (both) | 13 / 5 | — | both captures |
| Board SMs / TPCs | 4 / 2 | — | kernels.csv |
| Board GPC clock | ~306 | MHz | T50 README (exploratory pass) ^2 |
Board RAM (qualia host) |
3.5 | GB | T29 comment ^3 |
/ free on board |
161 | GiB | T29 comment ^3 |
| Native board build of the CLI subset | ~30 | s | T29 comment ^3 |
QUALIA_LEASH_BASE_URL code consumers |
0 | — | T29 comment ^3 |
| Default agent URL | https://127.0.0.1:8080 |
— | T29 comment ^3 |
^1 Captured on the dev host’s WSL2 under nsys in an earlier session than the board work; the 4090
is shared, so durations are one contended sample and launch count/shape are the stable part.
^2 Pinkie, native aarch64, ncu — the first board capture in the tree. Manual, because the board has
no nsys and no mage. Durations are ncu’s isolated replay, not a throughput measurement.
^3 The T29 deploy smoke at 25f2b6f7, taken in a session different from both captures.
The commit range this entry describes is 25f2b6f..f6893d2 — the first board deploy through the merge
of the T50 Pinkie capture. This entry’s epic is
EPIC-10 (#15).
What this does not establish
- No mission had run at this entry’s endpoint. The epic’s actual acceptance — open one exploration
mission, watch
open_missionsgo 1 then 0, see a sealed MCAP segment, the same mission id in the session list and the GUI and the same generation in the TUI — had not been attempted in this entry’s period, which ends atf6893d2(2026-09-11T17:55:18Z). See the note in “What we tried” for what has run since. - The first board run could not even reach a server. At
25f2b6f7,runners/agentandcrates/braidwere one-line stubs andqualia-inithad no binary, soqualia runrefused andqualia health/plannerhung oncurlwith no-m;0/10manifest runners were active. The layers that now exist were in flight then. This is a snapshot of a stack that could not start, not a measurement of the one that can. - The 8.19× divides two different profilers. The board number is an
ncuisolated replay with its default clock and cache control; the 4090 number is annsyswall-clock capture from a different host and commit. Shapes and launch counts are the comparable part; the ratio is indicative. - One board capture, and the board was shared. Other agents were building and running on Pinkie
in the same window;
belief_updatewas captured five times across the session with a 0.21 % spread, so contention moved the second decimal, not the number — but the runs are reported as agreeing rather than undisturbed. - The memory budget is unproven on the board. The ≤ 6 GiB plan and the
sm_87/sm_89fatbin targets were T18 (#33, thenstatus:ready); T18 has since landed (60beee4, PR #207, merged 2026-09-11T20:16:14Z, capture atdocs/evidence/T18/fatbin-sm-87/). Nothing in this entry shows the stack fitting in the board’s 8 GB. - The board clock is about 10 days behind (
date -uread 2026-09-01 when the host read 2026-09-11), which the deploy comment flags as a hazard for anything depending on TLS to a remote upstream; nothing in this entry depends on it.